




AUD/USD Weekly Outlook: Fed Bets Boost Aussie as US Data Weakens
AUD/USD eyes a rebound as weak US data revives Fed cut bets, though RBA expectations and key US services data will shape direction this week.
Share this:

AUD/USD rebounded on Friday after a run of weak US data triggered renewed bets for Federal Reserve rate cuts. While this snapped a five-day losing streak for the Aussie, it still closed the week lower against the greenback. Traders now turn their attention to this week’s ISM services data and RBA meeting, with both central banks' policy paths expected to steer AUD/USD’s next move.
View related analysis:
View related analysis:

Charts prepared by Matt Simpson - Data source: LSEG
AUD/USD Rebounds on Weak US Data but Faces Key Tests from RBA and ISM Services
US yields were lower alongside the US dollar on Friday on renewed bets of a September cut from the Federal Reserve (Fed).
Money markets are now implying that the Federal Reserve (Fed) will cut interest rates by 25bp in September, following weak data from Friday’s Nonfarm Payrolls (NFP) and PMI reports. This is despite the FOMC minutes pouring cold water on such a move earlier in the week, but the data set is hard to ignore.
Only 73k jobs were added to the economy in July – well below the 106k expected – but perhaps more alarming was the sharp revision to June’s figures, down from 147k to just 14k. While unemployment remained relatively low and flat at 4.2%, June’s data is uncomfortably close to signalling contraction. The US manufacturing sector also contracted for a fifth month in June, according to the latest PMI figures, with the employment index falling to a one-year low of 43.4. New orders contracted for a sixth consecutive month.
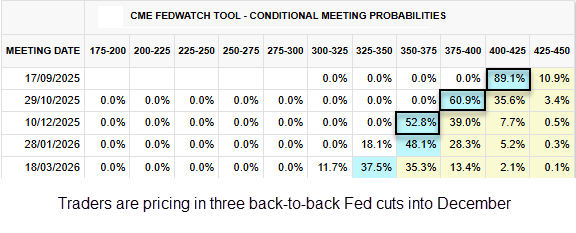
Chart Source: CME Group
This week’s ISM services report will be closely scrutinised, as any further signs of weakness will only bolster expectations for the Fed to act. And that could still be a bullish cue for AUD/USD traders, despite renewed expectations that the RBA will cut next week.
Quarterly inflation figures likely pave the way for the RBA to ease by 25bp, though I suspect they’ll refrain from being too dovish and will continue to emphasise caution in the outlook. Meanwhile, with money markets trying to price in three back-to-back cuts by December, the US dollar may have further to fall in relative terms than the Australian dollar – putting AUD/USD back on bullish breakout watch.
AUD/USD technical analysis
We have contrasting signals on the weekly and daily charts of AUD/USD. The weekly chart suggests the Australian dollar is finally topping out, while the daily chart has presented a bullish signal in the near term.
The daily RSI(2) was extremely oversold on Wednesday and Thursday ahead of Friday’s rebound, which saw a bullish engulfing candle form part of a three-bar bullish reversal (morning star pattern) just above the high-volume node (HVN) at 0.6414. AUD/USD now appears to be heading for the 65c level, with potential to break above its 50-day EMA (0.6509) and 20-day EMA (0.6523).
Whether it can make a run for 66c likely depends on whether the US ISM services report signals further weakness in the US economy—particularly if prices paid fall fast enough to lower inflation expectations. However, if the report delivers another set of solid figures, upside for AUD/USD could be capped and the US dollar may regain some bullish attention.
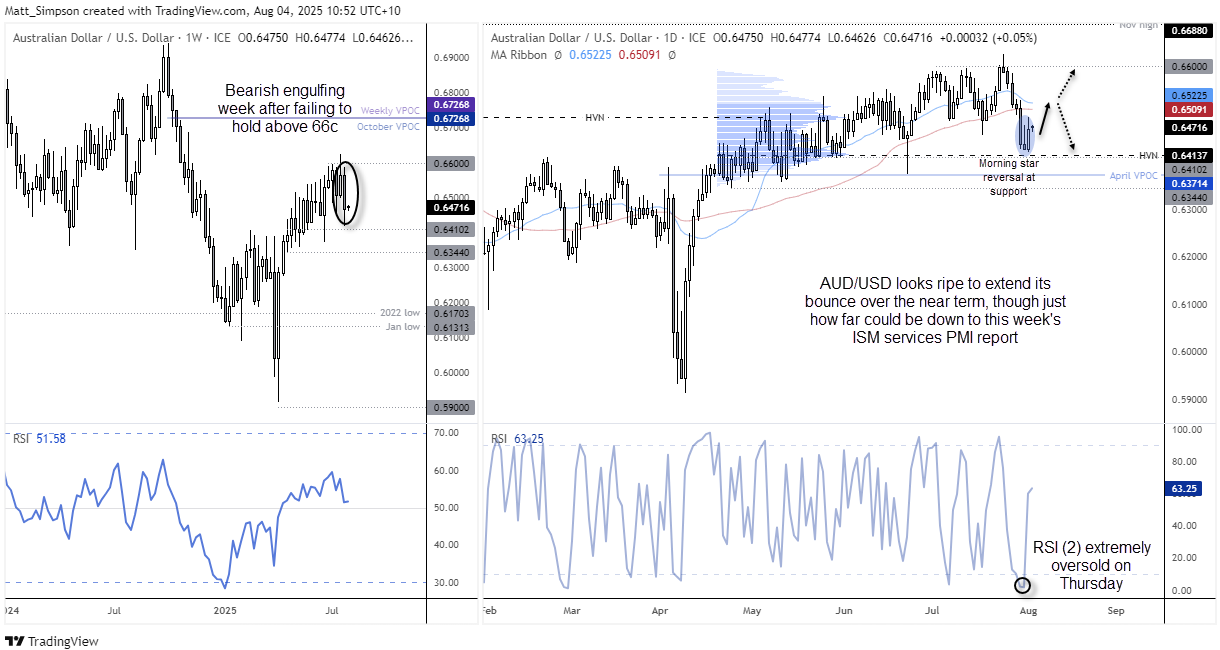
Chart analysis by Matt Simpson - Data source: TradingView, ICE AUD/USD
AUD/USD correlations:
Most market moves can be traced back to Fed monetary policy expectations, which means the US dollar tends to track US yields higher or lower—and AUD/USD shares a strong inverse correlation with both. The 20-day rolling correlation between the US dollar index and AUD/USD has risen to a very high level of 0.96, indicating an almost perfect relationship.
While the correlations between AUD/USD and NZD/USD and the Chinese yuan are even stronger—at 0.98 and 0.97 respectively—these, too, can largely be traced back to the US dollar, yields, and Fed policy expectations.

Charts prepared by Matt Simpson - Data source: LSEG
View the full economic calendar
View the full economic calendar
-- Written by Matt Simpson
Follow Matt on Twitter @cLeverEdge
How to trade with City Index
You can trade with City Index by following these four easy steps:
- Open an account, or log in if you’re already a customer
• Open an account in the UK
• Open an account in Australia
• Open an account in Singapore
- Search for the market you want to trade in our award-winning platform
- Choose your position and size, and your stop and limit levels
- Place the trade
Latest market news



Open an account in minutes
Experience award-winning platforms with fast and secure execution, and enjoy tight spreads from 0.5 pts on FX and 0.3 pts on indices.
Economic calendar
Web Trader platform
Our sophisticated web-based platform is packed with features.
Related articles
New Zealand inflation report puts spotlight on hawkish RBNZ pricing
New Zealand's recovery is barely underway, yet markets have priced a series of RBNZ rate hikes. Thursday's inflation report will put that hawkish recalibration under the microscope.
British Pound Rallies into CPI as BoE Hike Bets Firm - GBP/USD, GBP/AUD
Sterling rallies ahead of UK inflation as BoE hike bets firm. GBP/USD tests resistance while GBP/AUD forms a potential bullish reversal.
GBP/USD Analysis: Sterling Gains Momentum After Employment Surprise
Over recent trading sessions, the British pound has begun to show a notable recovery. This can be observed in the performance of GBP/USD, which has gained more than 1.3% over the last four sessions, reflecting a consistent improvement in sterling's strength against the U.S. dollar.

This report is intended for general circulation only. It should not be construed as a recommendation, or an offer (or solicitation of an offer) to buy or sell any financial products. The information provided does not take into account your specific investment objectives, financial situation or particular needs. Before you act on any recommendation that may be contained in this report, independent advice ought to be sought from a financial adviser regarding the suitability of the investment product, taking into account your specific investment objectives, financial situation or particular needs.
StoneX Financial Pte. Ltd., may distribute reports produced by its respective foreign entities or affiliates within the StoneX group of companies or third parties pursuant to an arrangement under Regulation 32C of the Financial Advisers Regulations. Where the report is distributed to a person in Singapore who is not an accredited investor, expert investor or an institutional investor (as defined in the Securities Futures Act), StoneX Financial Pte. Ltd. accepts legal responsibility to such persons for the contents of the report only to the extent required by law. Singapore recipients should contact StoneX Financial Pte. Ltd. at 6826 9988 for matters arising from, or in connection with the report.
In the case of all other recipients of this report, to the extent permitted by applicable laws and regulations neither StoneX Financial Pte. Ltd. nor its associated companies will be responsible or liable for any loss or damage incurred arising out of, or in connection with, any use of the information contained in this report and all such liability is hereby expressly disclaimed. No representation or warranty is made, express or implied, that the content of this report is complete or accurate.
StoneX Financial Pte. Ltd. is not under any obligation to update this report.
Trading CFDs carries a high level of risk that may not be suitable for some investors. Consider your investment objectives, level of experience, financial resources, risk appetite and other relevant circumstances carefully. The possibility exists that you could lose some or all of your investments, including your initial deposits. If in doubt, please seek independent expert advice. Visit www.forex.com/en-sg/terms-and-policies for the complete Risk Disclosure Statement.