




British Pound Technical Analysis: GBP/USD 1.3000 Resistance Test
GBP/USD has shown its strongest monthly gain in March since November of 2023, and the question now is whether bulls can hold the move after testing the key resistance level at 1.3000.
Share this:

British Pound Talking Points:
- GBP/USD put in some effort to break-above the 1.3000 handle, but bulls haven’t yet been able to leave the big figure behind.
- This morning’s UK CPI helped to extend a pullback and that’s allowed for a fresh weekly low; but as of this writing the 1.2900 support level is putting up a fight.
It’s been a strong year so far for GBP/USD, and that probably catches many by surprise given how weak the pair looked into last year’s close. But that sell-off only drove for a couple of weeks into the New Year and since setting a low on January 13th, bulls have been in charge.
So far for this month GBP/USD is up by a little more than 2.5%, which would be the largest monthly gain for the pair since November of 2023; and the third largest since the open of that year.
More recently it’s the 1.3000 psychological level that’s held bulls back from a stronger breakout and as we wind into the end of the month, that’s helped to push a pullback in the pair.
GBP/USD Monthly Chart
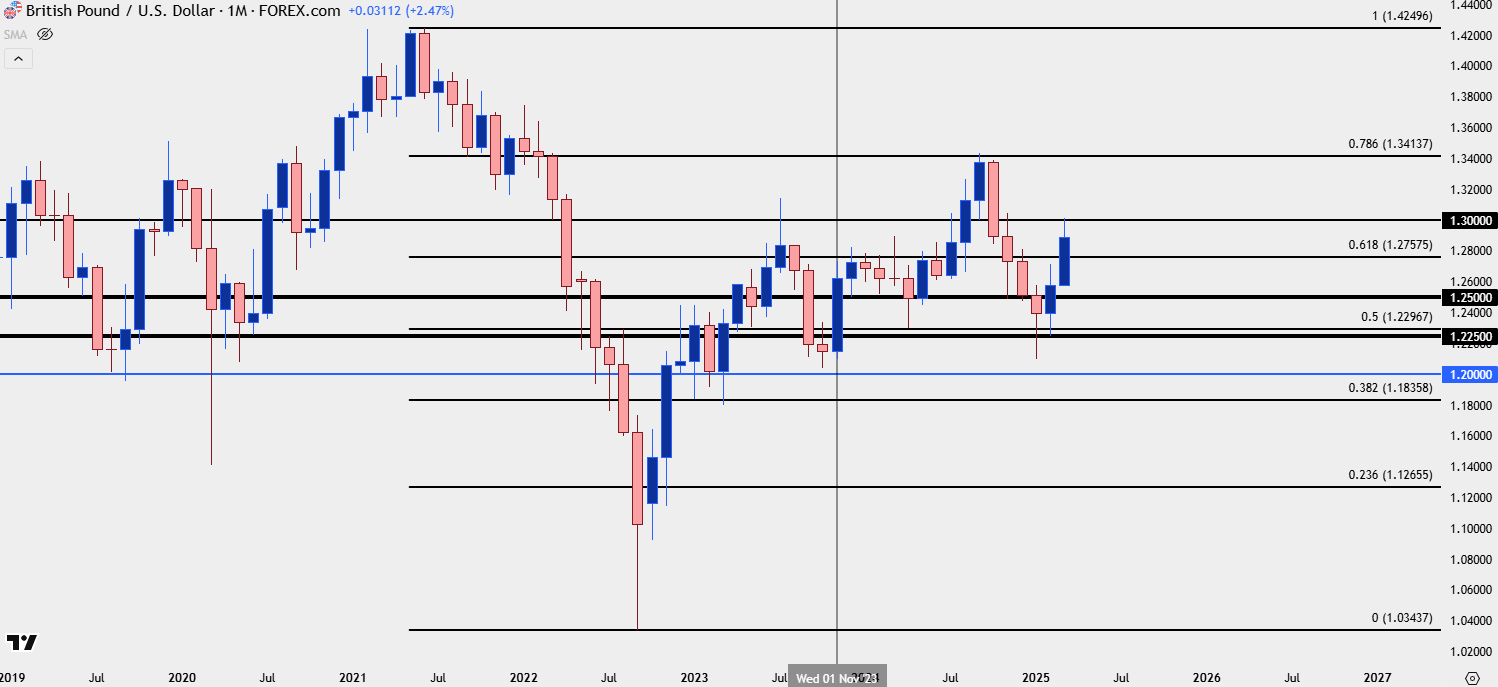 Chart prepared by James Stanley; data derived from Tradingview
GBP/USD Engaging with 1.3000
From the weekly chart we can get a better view of just how aggressively that 1.3000 level has stalled bulls. A doji two weeks ago showed as a lower-high, with buyers unable to get all the way up to the 1.3000 level; but the week after they were able to test above and similarly couldn’t find the drive to continue the bullish trend. Last week’s candle also closed as indecisive, although the wider body makes it look more like a spinning top than a doji.
And, so far this week, that stalling at resistance has followed through with another red weekly candle as the pullback has continued thus far.
GBP/USD Weekly Chart
 Chart prepared by James Stanley; data derived from Tradingview
GBP/USD Shorter-Term
Interestingly if we look at the US Dollar as the mirror image of this move, the bounce in USD has been a larger pullback in the 2025 sell-off in DXY than the pullback has been in GBP/USD. As such, this can keep GBP/USD as attractive for USD-weakness scenarios, as the GBP-strength that’s helped the pair to hold up a bit better than the Euro is something that could make another run of USD-weakness show more prominently. But, as of right now, we have to call this what it is as this morning has produced a fresh lower-low and that goes along with the earlier-week stall inside of the 1.3000 level, which could end up as a lower-high.
For today’s daily bar I think that the 1.2900 level is key: This is the 38.2% Fibonacci retracement of the 2023-2024 major move in the pair, and this is what had helped to set support until this morning’s push to a fresh low. As of this writing it appears as though bulls are responding to that pullback with price attempting to pull back above the 1.2900 level, and if the daily closes like this, it could look attractive as a defense of support.
GBP/USD Daily Chart
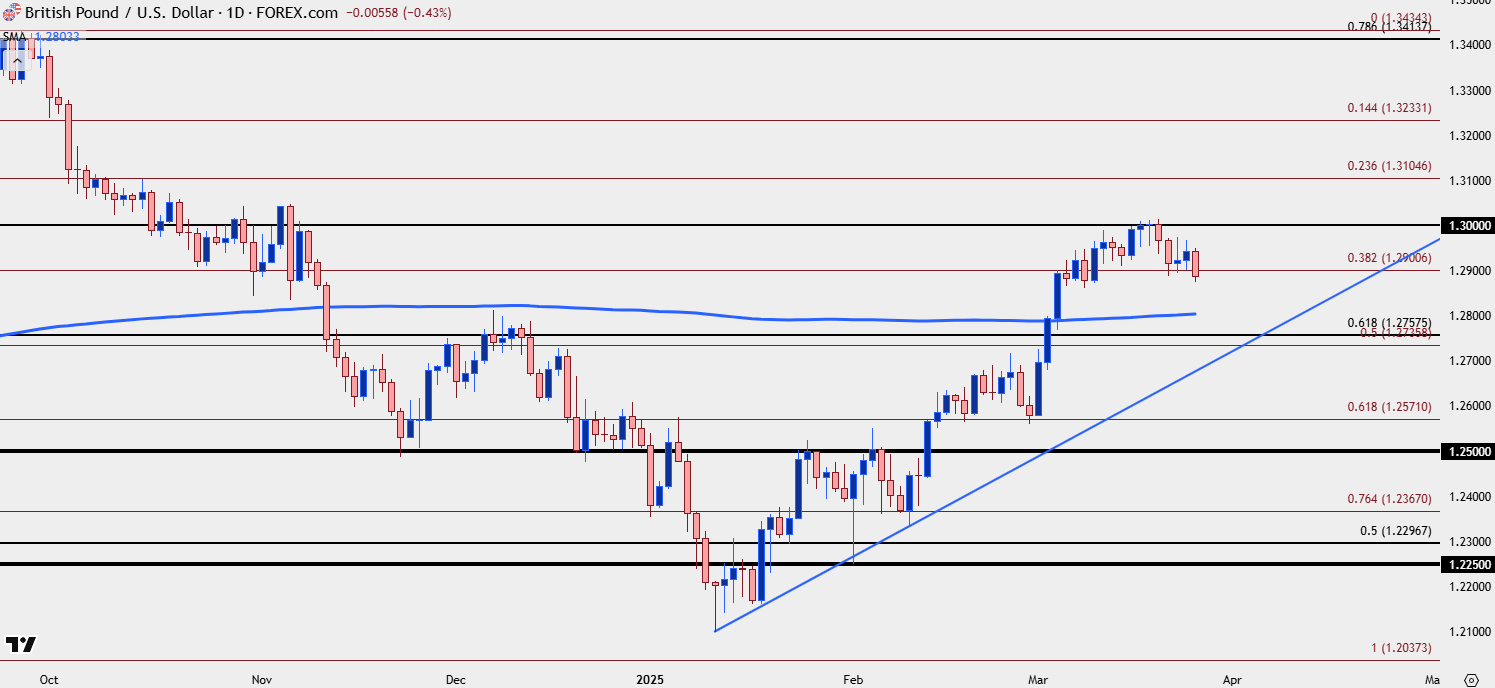 Chart prepared by James Stanley; data derived from Tradingview
--- written by James Stanley, Senior Strategist
British Pound Talking Points:
- GBP/USD put in some effort to break-above the 1.3000 handle, but bulls haven’t yet been able to leave the big figure behind.
- This morning’s UK CPI helped to extend a pullback and that’s allowed for a fresh weekly low; but as of this writing the 1.2900 support level is putting up a fight.
It’s been a strong year so far for GBP/USD, and that probably catches many by surprise given how weak the pair looked into last year’s close. But that sell-off only drove for a couple of weeks into the New Year and since setting a low on January 13th, bulls have been in charge.
So far for this month GBP/USD is up by a little more than 2.5%, which would be the largest monthly gain for the pair since November of 2023; and the third largest since the open of that year.
More recently it’s the 1.3000 psychological level that’s held bulls back from a stronger breakout and as we wind into the end of the month, that’s helped to push a pullback in the pair.
GBP/USD Monthly Chart

GBP/USD Engaging with 1.3000
From the weekly chart we can get a better view of just how aggressively that 1.3000 level has stalled bulls. A doji two weeks ago showed as a lower-high, with buyers unable to get all the way up to the 1.3000 level; but the week after they were able to test above and similarly couldn’t find the drive to continue the bullish trend. Last week’s candle also closed as indecisive, although the wider body makes it look more like a spinning top than a doji.
And, so far this week, that stalling at resistance has followed through with another red weekly candle as the pullback has continued thus far.
GBP/USD Weekly Chart
GBP/USD Shorter-Term
Interestingly if we look at the US Dollar as the mirror image of this move, the bounce in USD has been a larger pullback in the 2025 sell-off in DXY than the pullback has been in GBP/USD. As such, this can keep GBP/USD as attractive for USD-weakness scenarios, as the GBP-strength that’s helped the pair to hold up a bit better than the Euro is something that could make another run of USD-weakness show more prominently. But, as of right now, we have to call this what it is as this morning has produced a fresh lower-low and that goes along with the earlier-week stall inside of the 1.3000 level, which could end up as a lower-high.
For today’s daily bar I think that the 1.2900 level is key: This is the 38.2% Fibonacci retracement of the 2023-2024 major move in the pair, and this is what had helped to set support until this morning’s push to a fresh low. As of this writing it appears as though bulls are responding to that pullback with price attempting to pull back above the 1.2900 level, and if the daily closes like this, it could look attractive as a defense of support.
GBP/USD Daily Chart
--- written by James Stanley, Senior Strategist
Related tags:
Latest market news




Open an account in minutes
Experience award-winning platforms with fast and secure execution, and enjoy tight spreads from 0.5 pts on FX and 0.3 pts on indices.
Economic calendar
Web Trader platform
Our sophisticated web-based platform is packed with features.
Related articles
Equity Indices Q4, 2026 Outlook: Cracks Begin to Show
There's still an open door for a melt-up in the S&P 500 and Nasdaq but the Dow and Russell 2000 are looking more vulnerable, and until calm hits the Treasuries market there's a higher probability for volatility. The big question is whether that's a next quarter theme or not.

Oil Quietly Hands the Fed a Reason to Stay Hawkish
Oil prices and the U.S. dollar are both on the front foot as elevated energy costs feed Fed warnings that inflation may prove sticky.


S&P 500 forecast: Stocks extend drop as correction risks grow
US and global equity markets have extended Wednesday’s sell-off, with Wall Street opening lower after a weak handover from Asia and Europe. The deterioration in risk appetite has been spreading across global markets. The dollar was firmer, Treasury yields were holding onto yesterday’s gains, while gold, silver and bitcoin were all under pressure alongside equities and major currencies.
This report is intended for general circulation only. It should not be construed as a recommendation, or an offer (or solicitation of an offer) to buy or sell any financial products. The information provided does not take into account your specific investment objectives, financial situation or particular needs. Before you act on any recommendation that may be contained in this report, independent advice ought to be sought from a financial adviser regarding the suitability of the investment product, taking into account your specific investment objectives, financial situation or particular needs.
StoneX Financial Pte. Ltd., may distribute reports produced by its respective foreign entities or affiliates within the StoneX group of companies or third parties pursuant to an arrangement under Regulation 32C of the Financial Advisers Regulations. Where the report is distributed to a person in Singapore who is not an accredited investor, expert investor or an institutional investor (as defined in the Securities Futures Act), StoneX Financial Pte. Ltd. accepts legal responsibility to such persons for the contents of the report only to the extent required by law. Singapore recipients should contact StoneX Financial Pte. Ltd. at 6826 9988 for matters arising from, or in connection with the report.
In the case of all other recipients of this report, to the extent permitted by applicable laws and regulations neither StoneX Financial Pte. Ltd. nor its associated companies will be responsible or liable for any loss or damage incurred arising out of, or in connection with, any use of the information contained in this report and all such liability is hereby expressly disclaimed. No representation or warranty is made, express or implied, that the content of this report is complete or accurate.
StoneX Financial Pte. Ltd. is not under any obligation to update this report.
Trading CFDs carries a high level of risk that may not be suitable for some investors. Consider your investment objectives, level of experience, financial resources, risk appetite and other relevant circumstances carefully. The possibility exists that you could lose some or all of your investments, including your initial deposits. If in doubt, please seek independent expert advice. Visit www.forex.com/en-sg/terms-and-policies for the complete Risk Disclosure Statement.