





Crude Oil Analysis: WTI Breaks Back Above $70 Amid Potential Tariffs on Russian Oil
After falling to the $65 per barrel zone, WTI has posted a recovery of over 6% over the past two weeks of trading. For now, the bias remains neutral, as the market stays focused on the potential outcomes of U.S. trade tariffs.
Share this:

After falling to the $65 per barrel zone, WTI has posted a recovery of over 6% over the past two weeks of trading. For now, the bias remains neutral, as the market stays focused on the potential outcomes of U.S. trade tariffs, which have recently brought uncertainty even to the commodities market in the short term.
Tariff Pressures Intensify
Crude oil has also been impacted by recent tariff threats issued by President Donald Trump against various countries, contributing to a sustained upward pressure on WTI in most recent sessions.
The first warning was directed at countries engaging in oil trade with Venezuela, following an announcement by former President Donald Trump regarding the possible imposition of 25% sanctions on nations that continue to purchase Venezuelan crude oil. As part of this measure, the U.S. also moved to revoke international licenses held by companies such as Repsol, effectively restricting their ability to operate within Venezuela’s oil sector.
Furthermore, Trump has mentioned that similar measures could be applied to Russia, citing a lack of commitment to a ceasefire in Ukraine. A tariff ranging from 25% to 50% is being considered for countries buying Russian oil in the near term.
These potential sanctions on two major oil producers could significantly disrupt the global supply balance. According to recent data, Venezuela's daily output exceeds one million barrels (February 2025), while Russia’s production is at 9.7 million barrels per day (November 2024). If the White House moves forward with these tariffs, a notable supply reduction could follow. Given that demand remains stable for now, this scenario could serve as a bullish catalyst for WTI prices.
How Is Market Confidence Holding Up?
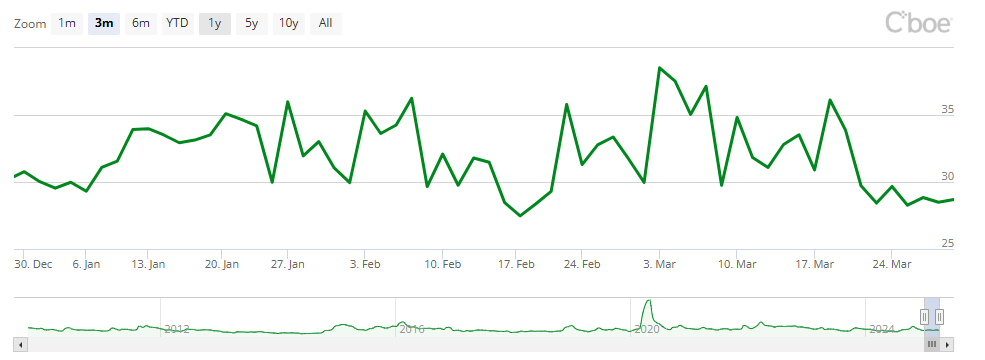
The OVX (Cboe Crude Oil Volatility Index), which measures expected 30-day volatility in oil prices, remains below the 30 level, showing a sideways movement in recent sessions.
Source: CBOE
A sustained decline in the OVX suggests that the market anticipates greater stability in oil prices. Volatility levels have remained relatively low compared to the past three months, indicating that amid global uncertainty, investors have opted for a more stable positioning in this market.
If the OVX remains at or below 30, market confidence in oil could stabilize, supporting a short-term bullish bias in WTI. However, if the index climbs above 40 again, the selling pressure seen in early March could resurface.
WTI Technical Outlook
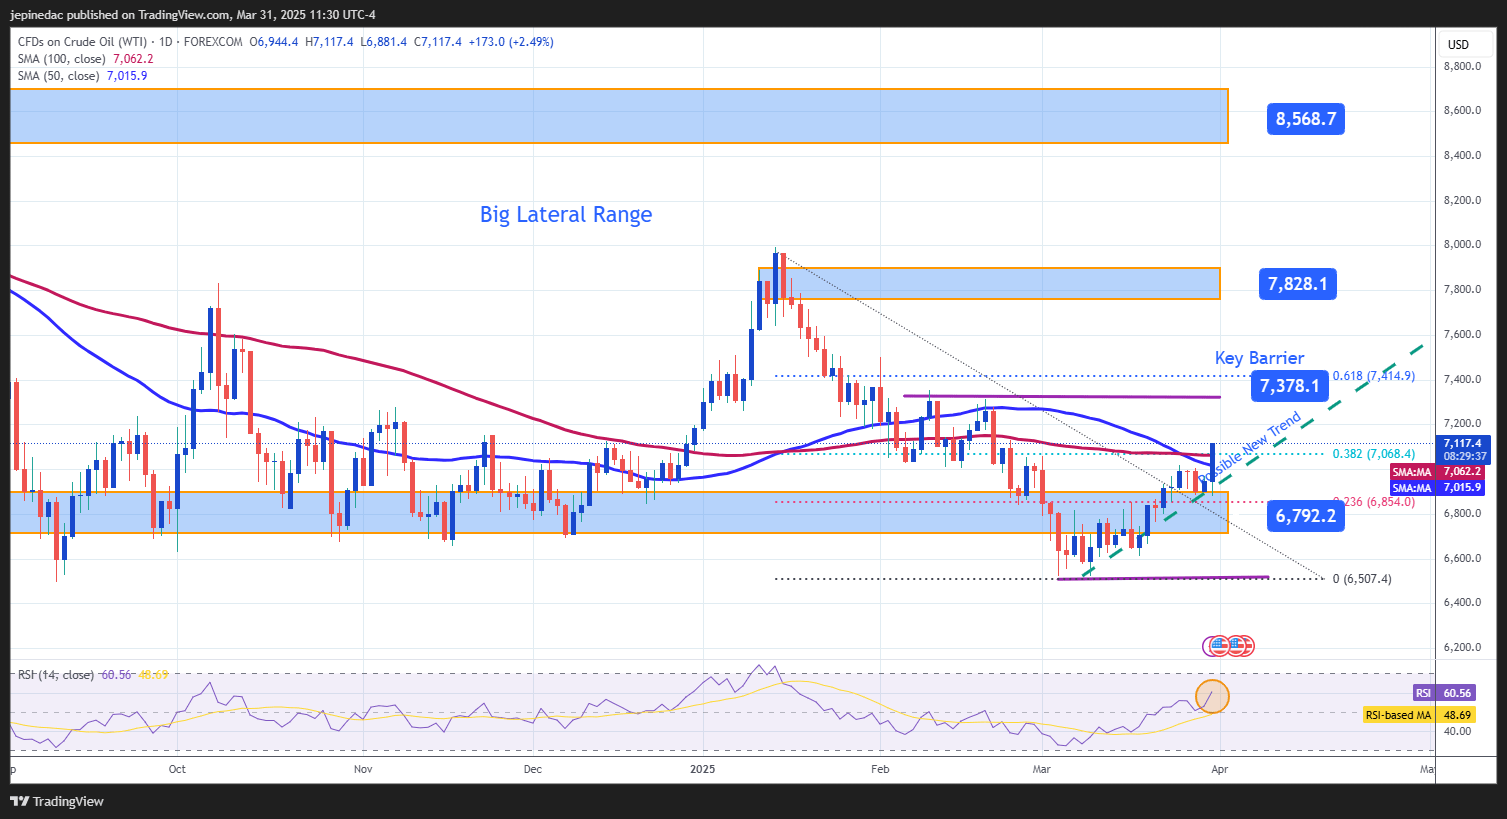
Source: StoneX, Tradingview
- Wide Sideways Channel: WTI continues to trade within a lateral channel, with $85 as resistance and $67 as support. This pattern has held firm for several months, with the support level once again halting recent bearish momentum. For now, this channel remains the most relevant technical formation, as the price has yet to achieve a decisive breakout.
- Potential New Trend: Recent bullish price action has begun to trace a potential uptrend, which currently faces resistance around the 50- and 100-period moving averages. If buying pressure persists, this new trendline could become more significant in the short term.
- RSI: The Relative Strength Index has started to rise with a bullish slope, holding above the neutral 50 level in recent sessions. This indicates that the market's prevailing momentum has turned bullish. As long as the RSI stays below the overbought zone (70), there are no clear signs of an imminent correction.
Key Levels:
- $73 – Key resistance: This level matches previous weekly highs and aligns with the 61.8% Fibonacci retracement, reinforcing its technical significance. A sustained breakout could pave the way for a stronger bullish trend over the medium term.
- $78 – Distant resistance: This remains the highest price reached in 2025. A move toward this level could solidify a more prolonged bullish phase in the coming months.
- $67 – Key support: This level marks the bottom of the lateral channel. A breakdown below it could cause the structure to collapse, triggering strong selling pressure and invalidating the tentative bullish trendline.
Written by Julian Pineda, CFA – Market Analyst
Related tags:




Open an account in minutes
Experience award-winning platforms with fast and secure execution, and enjoy tight spreads from 0.5 pts on FX and 0.3 pts on indices.
Economic calendar
Web Trader platform
Our sophisticated web-based platform is packed with features.
Related articles

S&P 500 Forecast: SPX rises after cooler-than-expected inflation data
U.S. stocks are rising and Treasury yields are falling after data showed that inflation increased at a cooler pace than expected, while U.S. consumer spending rose again in August.


Treasury Yields Lose Momentum as Energy ETF Retreats
The 10-year Treasury yield is testing a resistance zone respected since the 1920s, as bearish RSI divergence signals fading upside momentum.


GBP/USD, Oil Forecast: Two trades to watch 300926
GBP/USD: Can Stronger UK Growth Offset the Dollar’s Advantage? Oil: Supply Recovery Challenges the Geopolitical Premium.
This report is intended for general circulation only. It should not be construed as a recommendation, or an offer (or solicitation of an offer) to buy or sell any financial products. The information provided does not take into account your specific investment objectives, financial situation or particular needs. Before you act on any recommendation that may be contained in this report, independent advice ought to be sought from a financial adviser regarding the suitability of the investment product, taking into account your specific investment objectives, financial situation or particular needs.
StoneX Financial Pte. Ltd., may distribute reports produced by its respective foreign entities or affiliates within the StoneX group of companies or third parties pursuant to an arrangement under Regulation 32C of the Financial Advisers Regulations. Where the report is distributed to a person in Singapore who is not an accredited investor, expert investor or an institutional investor (as defined in the Securities Futures Act), StoneX Financial Pte. Ltd. accepts legal responsibility to such persons for the contents of the report only to the extent required by law. Singapore recipients should contact StoneX Financial Pte. Ltd. at 6826 9988 for matters arising from, or in connection with the report.
In the case of all other recipients of this report, to the extent permitted by applicable laws and regulations neither StoneX Financial Pte. Ltd. nor its associated companies will be responsible or liable for any loss or damage incurred arising out of, or in connection with, any use of the information contained in this report and all such liability is hereby expressly disclaimed. No representation or warranty is made, express or implied, that the content of this report is complete or accurate.
StoneX Financial Pte. Ltd. is not under any obligation to update this report.
Trading CFDs carries a high level of risk that may not be suitable for some investors. Consider your investment objectives, level of experience, financial resources, risk appetite and other relevant circumstances carefully. The possibility exists that you could lose some or all of your investments, including your initial deposits. If in doubt, please seek independent expert advice. Visit www.forex.com/en-sg/terms-and-policies for the complete Risk Disclosure Statement.