




DXY Driving US Dollar Pairs
As a result of the DXY move, related pairs are also having a big day.
Share this:

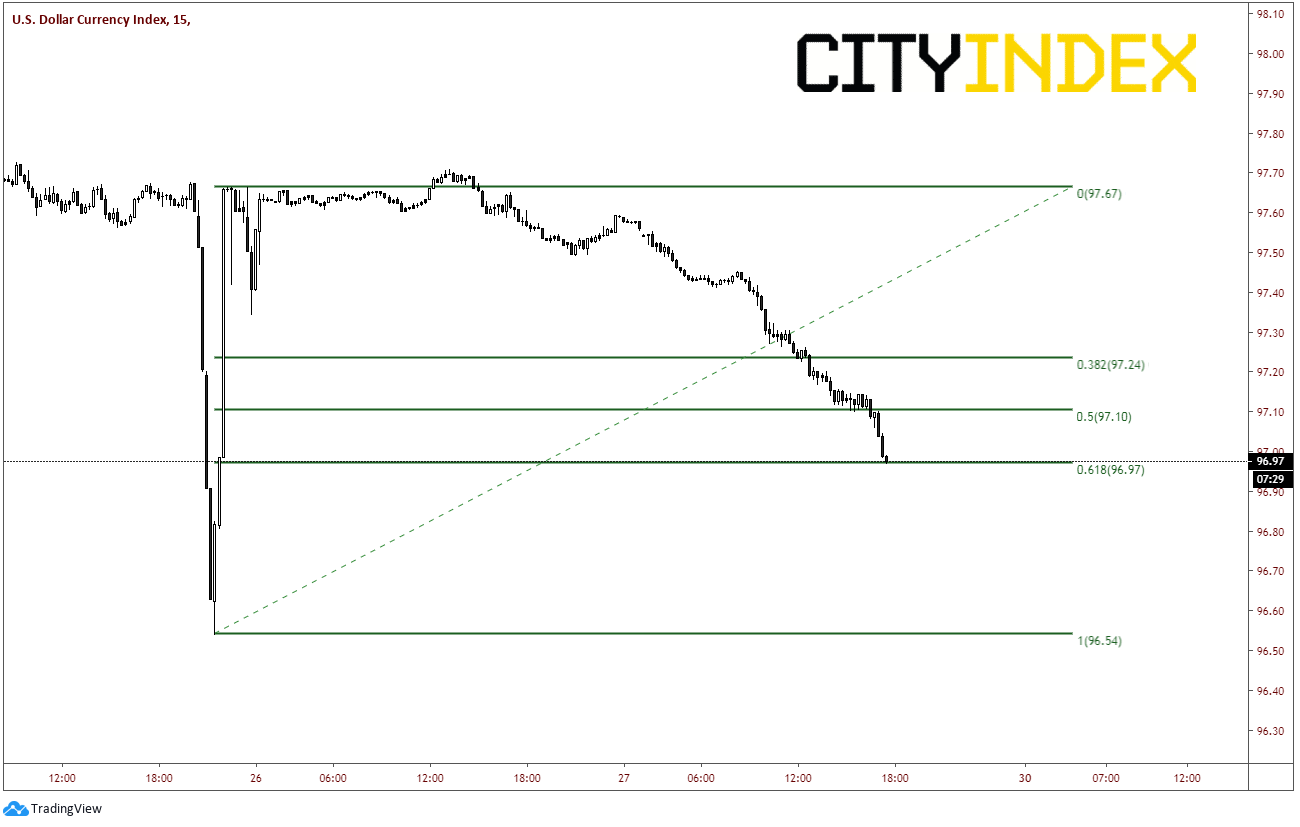
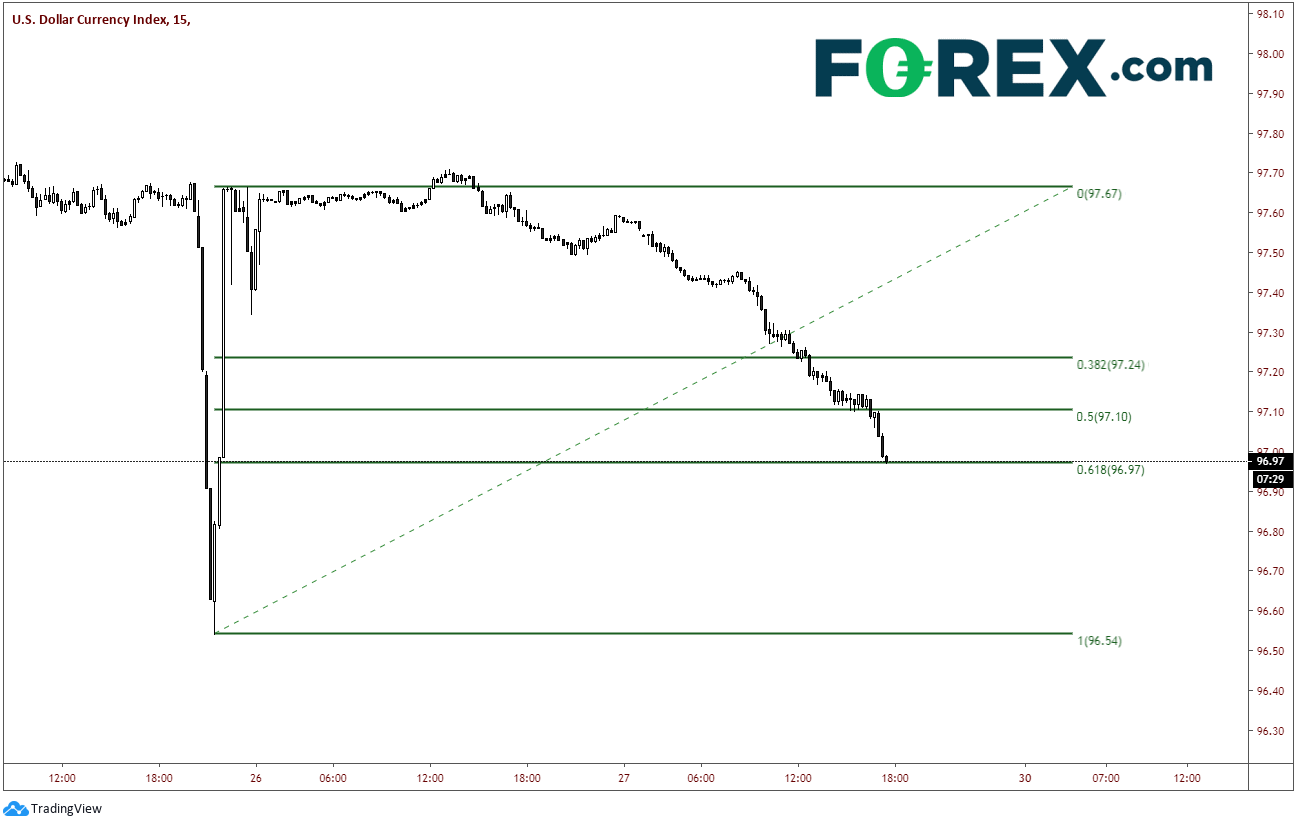
Yesterday we wrote about how the DXY had a nasty move on December 25th/26th during quiet trading, which was exacerbated by the holiday with many markets closed. Price spiked lower by over 100 pips and bounced back to unchanged within 2 hours! Looks like there may be some real money behind that move as the US Dollar Index continues to move lower today. The move on the 25th had the looks of a Central Bank all over it (ie..no idea how to trade, just get it done). Whoever is selling US Dollars today seems to have learned from that move. Instead of dumping the US Dollar position all at once in a thin market, someone may have realized its smarter to piece meal the trade. (This is total speculation on my part).
Price so far today has retraced 61.8% of the spike lower to 96.97. If the US Dollar breaks below, price can easily run down to the spike low at 96.59. And as we have discussed before, if someone needs to get something done heading into year end, price and technical won’t matter.
Source: Tradingview, City Index
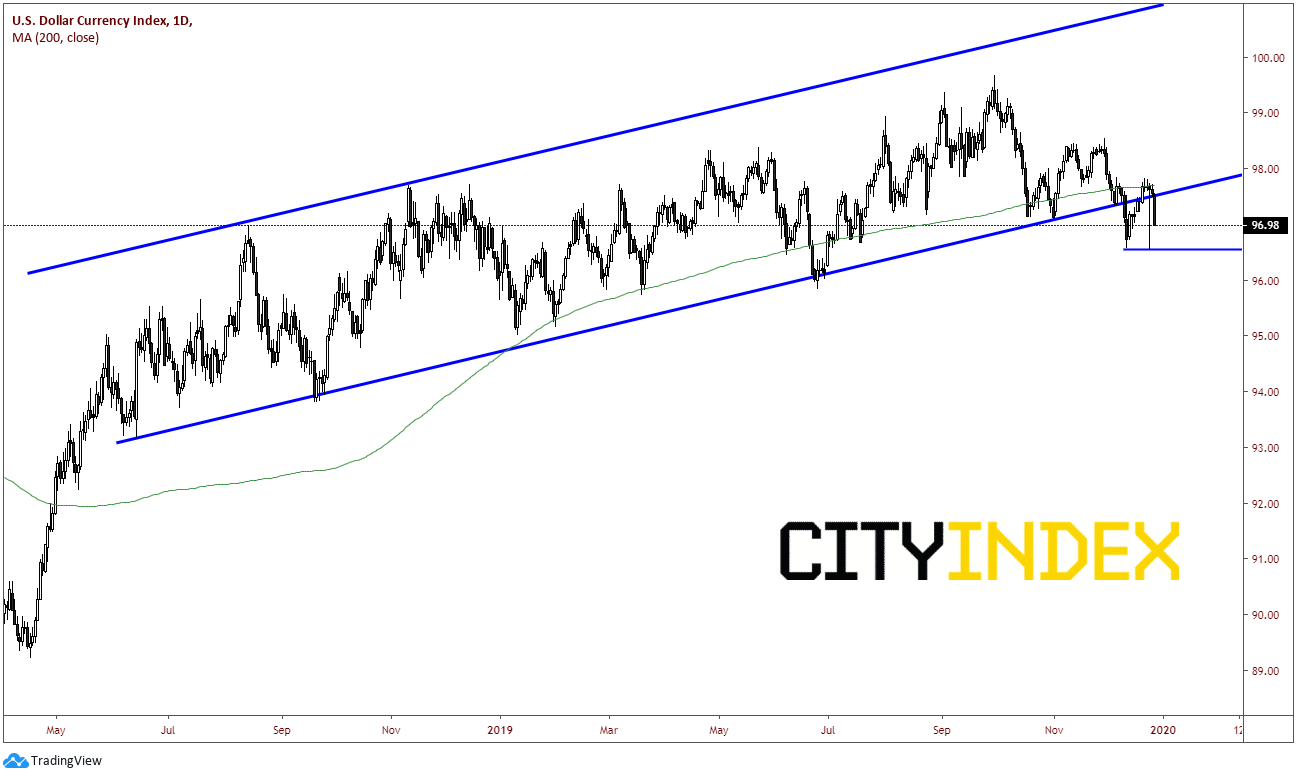
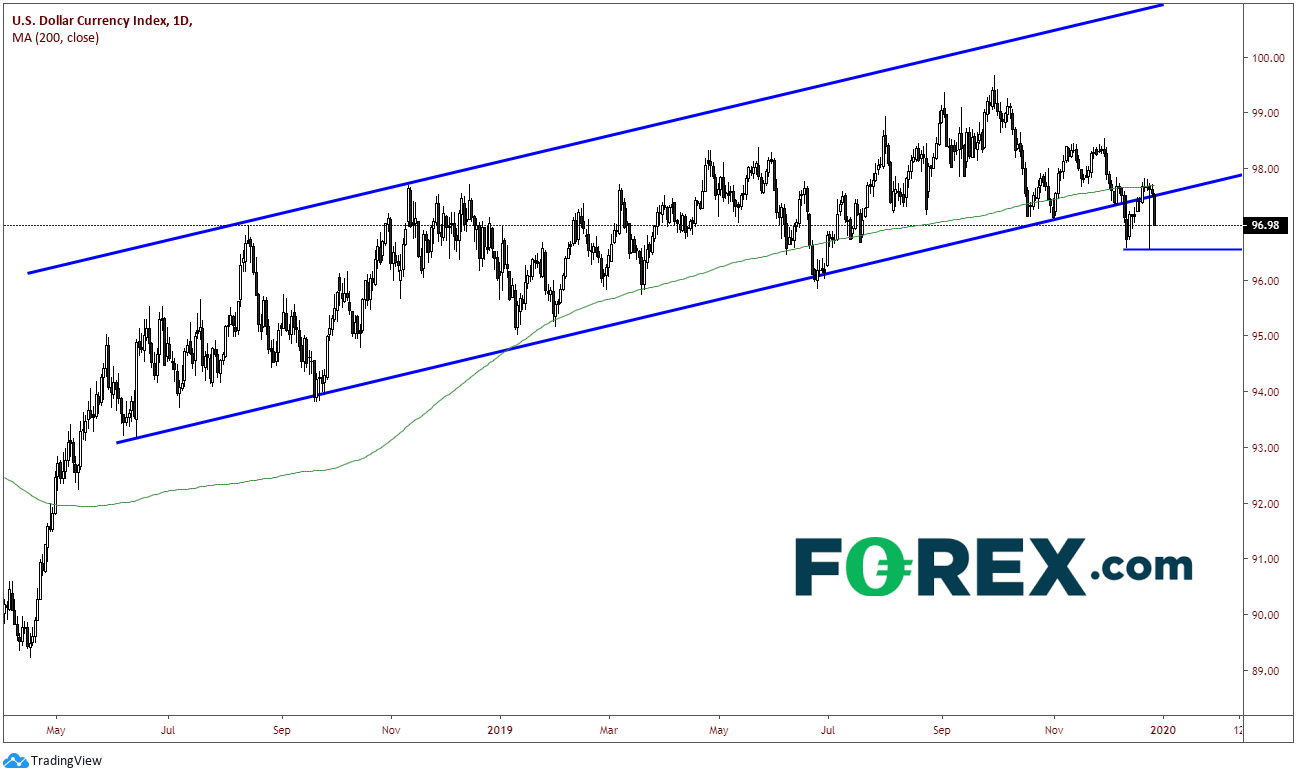
On a daily timeframe, the US Dollar broke lower on December 13th out of the upward sloping channel where price has been since mid-2018. Price then bounced and retested the bottom trendline of the channel and the 200-day moving average near 97.70. With the spike lower to the lows of December 13th, it opened the door for another move lower to the 96.59 level as possible a decisive move lower away from the channel!
Source: Tradingview, City Index
As a result of the US Dollar move, related pairs such as EUR/USD and GBP/USD are also having a big day.
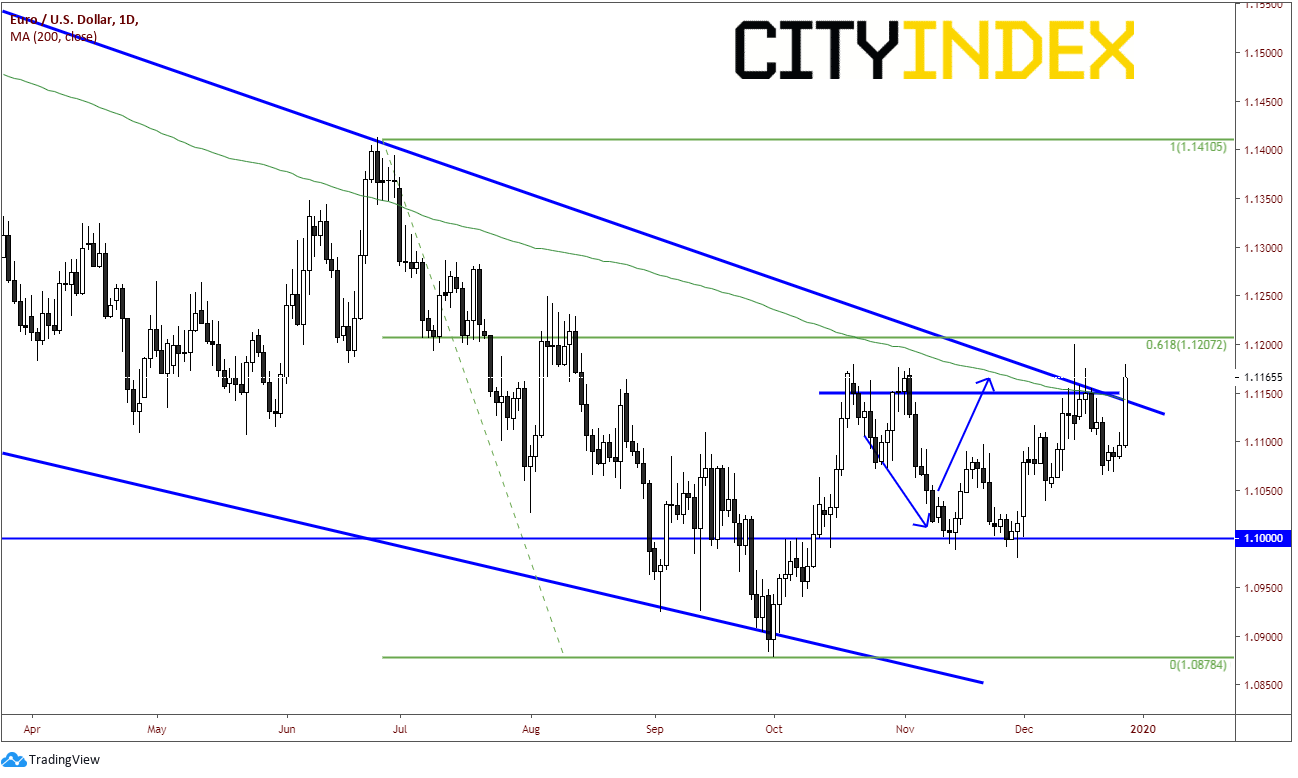
EUR/USD is up 75 pips near 1.1170 and looking to retest the highs from December 13th and the 61.8% Fibonacci retracement level from the June 25th highs to the October 1st lows near 1.1207.
Source: Tradingview, City Index
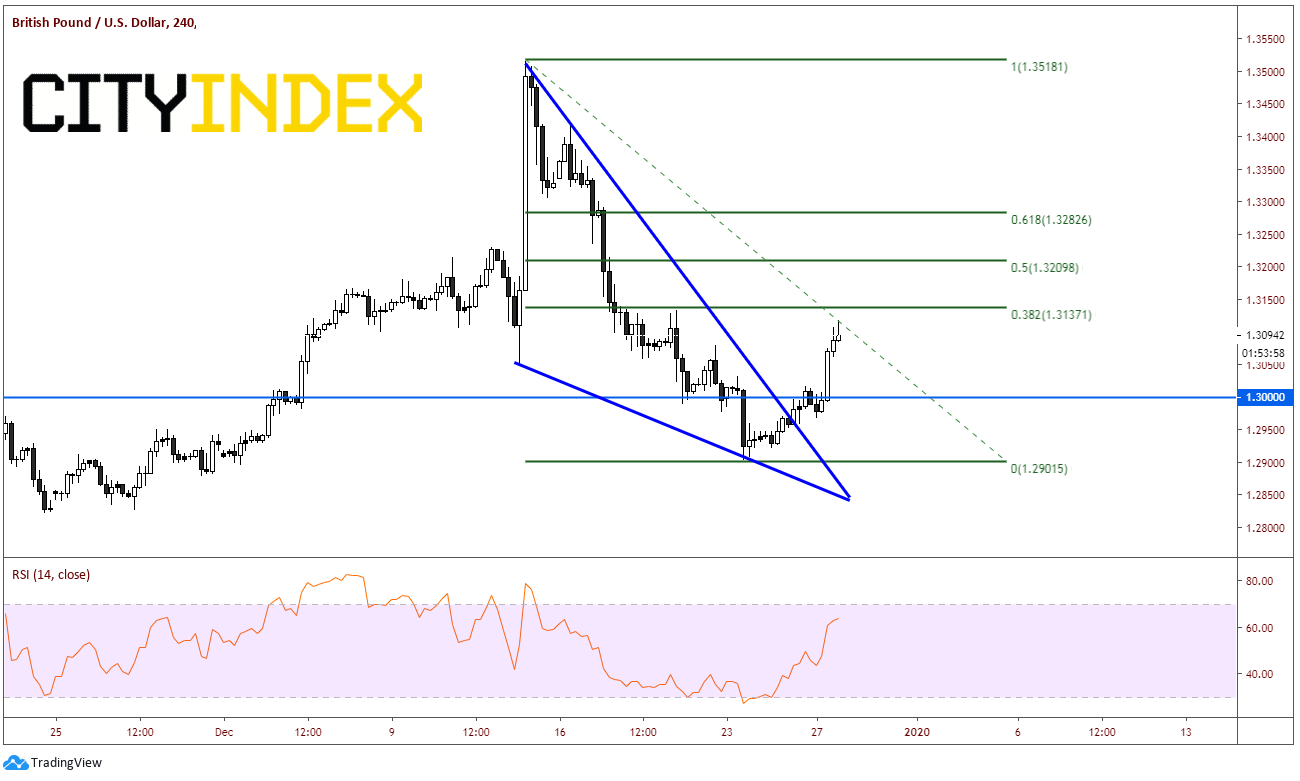
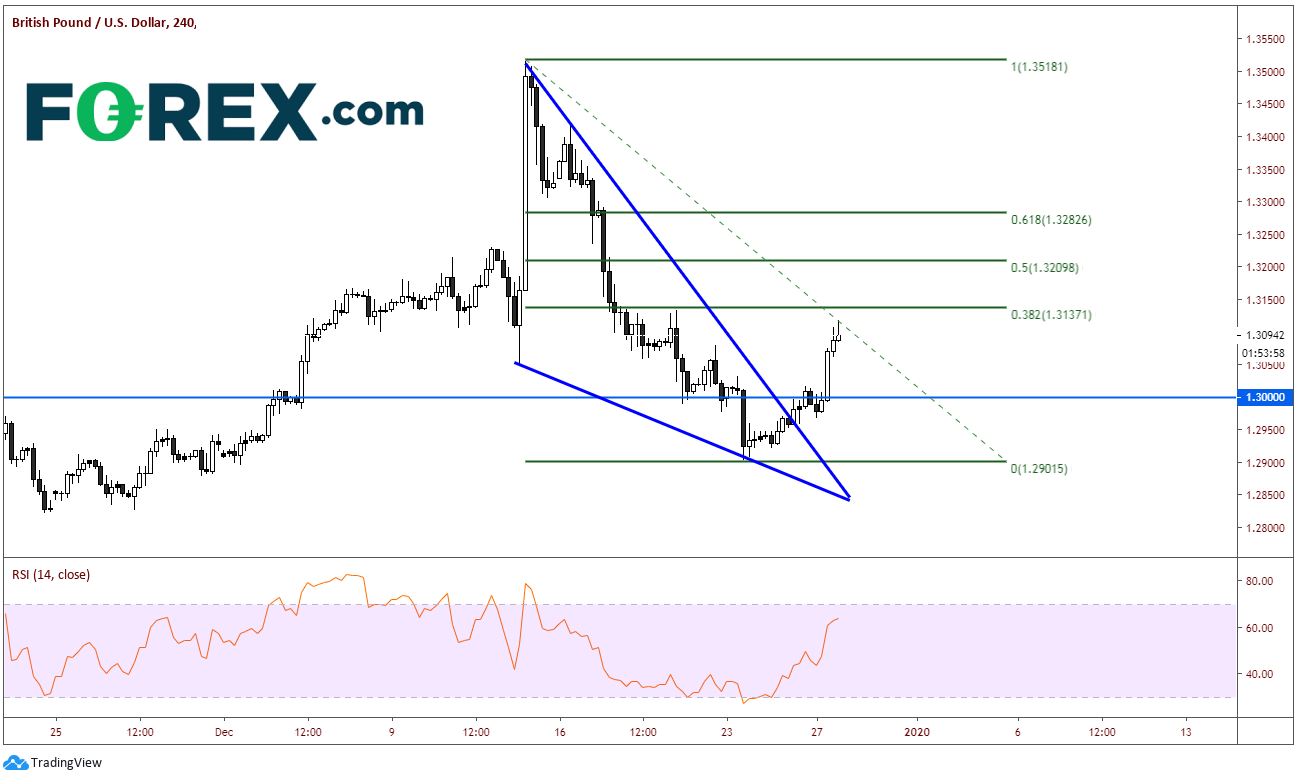
GBP/USD is up over 100 pips near 1.3090 and looking to test the 38.2% Fibonacci retracement level from the spike higher on December 12th after the election to the low on December 23rd at 1.3137. Resistance above isn’t until 1.3210, which is the 50% retracement level.
Source: Tradingview, City Index
Watch for these trends continue into year end early next week!
Yesterday we wrote about how the DXY had a nasty move on December 25th/26th during quiet trading, which was exacerbated by the holiday with many markets closed. Price spiked lower by over 100 pips and bounced back to unchanged within 2 hours! Looks like there may be some real money behind that move as the US Dollar Index continues to move lower today. The move on the 25th had the looks of a Central Bank all over it (ie..no idea how to trade, just get it done). Whoever is selling US Dollars today seems to have learned from that move. Instead of dumping the US Dollar position all at once in a thin market, someone may have realized its smarter to piece meal the trade. (This is total speculation on my part).
Price so far today has retraced 61.8% of the spike lower to 96.97. If the US Dollar breaks below, price can easily run down to the spike low at 96.59. And as we have discussed before, if someone needs to get something done heading into year end, price and technical won’t matter.
Source: Tradingview, FOREX.com
On a daily timeframe, the US Dollar broke lower on December 13th out of the upward sloping channel where price has been since mid-2018. Price then bounced and retested the bottom trendline of the channel and the 200-day moving average near 97.70. With the spike lower to the lows of December 13th, it opened the door for another move lower to the 96.59 level as possible a decisive move lower away from the channel!
Source: Tradingview, FOREX.com
As a result of the US Dollar move, related pairs such as EUR/USD and GBP/USD are also having a big day.
EUR/USD is up 75 pips near 1.1170 and looking to retest the highs from December 13th and the 61.8% Fibonacci retracement level from the June 25th highs to the October 1st lows near 1.1207.
Source: Tradingview, FOREX.com
GBP/USD is up over 100 pips near 1.3090 and looking to test the 38.2% Fibonacci retracement level from the spike higher on December 12th after the election to the low on December 23rd at 1.3137. Resistance above isn’t until 1.3210, which is the 50% retracement level.
Source: Tradingview, FOREX.com
Watch for these trends continue into year end early next week!
Latest market news



Open an account in minutes
Experience award-winning platforms with fast and secure execution, and enjoy tight spreads from 0.5 pts on FX and 0.3 pts on indices.
Economic calendar
Web Trader platform
Our sophisticated web-based platform is packed with features.
Related articles
EUR/USD weekly outlook: Oil, inflation and NFP in focus
After coming under significant pressure in recent weeks, the EUR/USD came off its lows to finish the week on a positive note on Friday, albeit with only a mild rebound. That was not enough to prevent the exchange rate falling for the third consecutive week, as the US dollar and bond yields rallied across the board.


EUR/USD Q4 2026 Outlook: Euro at a Crossroads as Fed, ECB Tighten 9 25 2026
EUR/USD enters Q4 at a pivotal inflection point as competing Fed-ECB policy paths and persistent inflation risks collide with major technical support.

AUD/USD Q4 Outlook: RBA and Fed Hikes Set the Tone
AUD/USD enters Q4 with RBA and Fed hikes in focus as sticky inflation, rising unemployment and US dollar strength shape the Australian dollar.

This report is intended for general circulation only. It should not be construed as a recommendation, or an offer (or solicitation of an offer) to buy or sell any financial products. The information provided does not take into account your specific investment objectives, financial situation or particular needs. Before you act on any recommendation that may be contained in this report, independent advice ought to be sought from a financial adviser regarding the suitability of the investment product, taking into account your specific investment objectives, financial situation or particular needs.
StoneX Financial Pte. Ltd., may distribute reports produced by its respective foreign entities or affiliates within the StoneX group of companies or third parties pursuant to an arrangement under Regulation 32C of the Financial Advisers Regulations. Where the report is distributed to a person in Singapore who is not an accredited investor, expert investor or an institutional investor (as defined in the Securities Futures Act), StoneX Financial Pte. Ltd. accepts legal responsibility to such persons for the contents of the report only to the extent required by law. Singapore recipients should contact StoneX Financial Pte. Ltd. at 6826 9988 for matters arising from, or in connection with the report.
In the case of all other recipients of this report, to the extent permitted by applicable laws and regulations neither StoneX Financial Pte. Ltd. nor its associated companies will be responsible or liable for any loss or damage incurred arising out of, or in connection with, any use of the information contained in this report and all such liability is hereby expressly disclaimed. No representation or warranty is made, express or implied, that the content of this report is complete or accurate.
StoneX Financial Pte. Ltd. is not under any obligation to update this report.
Trading CFDs carries a high level of risk that may not be suitable for some investors. Consider your investment objectives, level of experience, financial resources, risk appetite and other relevant circumstances carefully. The possibility exists that you could lose some or all of your investments, including your initial deposits. If in doubt, please seek independent expert advice. Visit www.forex.com/en-sg/terms-and-policies for the complete Risk Disclosure Statement.