




Gold considers a bounce from key support, USD/JPY taps 145
Within the past 24 hours we have seen gold futures hold just above the big, psychological level of 1900 and hint at a rebound, whilst USD/JPY has tapped the key level of 145. Yet speculators seem nervous given the spike in puts relative to calls at these highs.
Share this:

Asian Indices:
- Australia's ASX 200 index fell by -2.2 points (-0.03%) and currently trades at 7,192.70
- Japan's Nikkei 225 index has fallen by -149.91 points (-0.45%) and currently trades at 33,084.42
- Hong Kong's Hang Seng index has risen by 4.37 points (0.02%) and currently trades at 18,938.73
- China's A50 Index has risen by 85.8 points (0.69%) and currently trades at 12,534.26
UK and Europe:
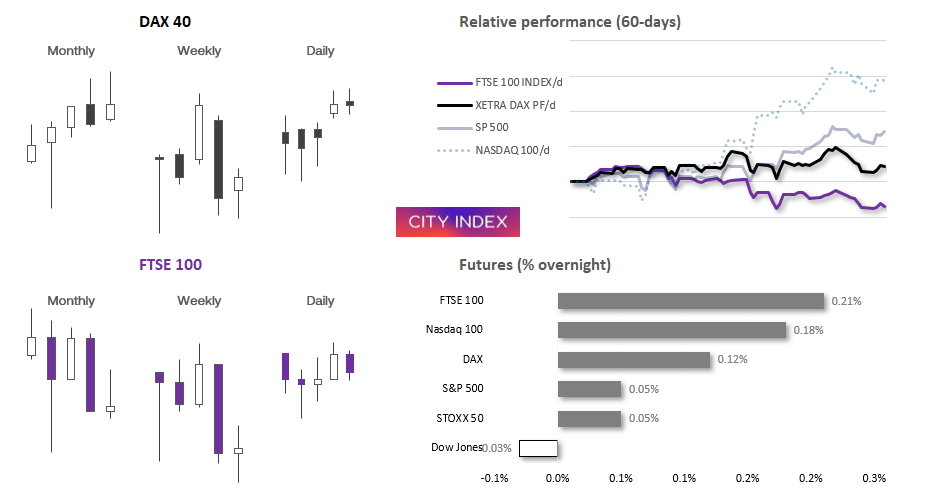
- UK's FTSE 100 futures are currently up 15.5 points (0.21%), the cash market is currently estimated to open at 7,487.19
- Euro STOXX 50 futures are currently up 1 points (0.02%), the cash market is currently estimated to open at 4,355.69
- Germany's DAX futures are currently up 19 points (0.12%), the cash market is currently estimated to open at 15,965.72
US Futures:
- DJI futures are currently down -13 points (-0.04%)
- S&P 500 futures are currently up 1.75 points (0.04%)
- Nasdaq 100 futures are currently up 27.25 points (0.18%)
- EUR/USD eventually fell in line with our bearish bias although stopped above last Friday’s low. Prices are consolidating ahead of the open and we see the potential for a pop higher towards the 1.0900 handle before losses resume (and break to new lows if PCE inflation is hotter than liked)
- USD/JPY tapped 145 for the first time since November 10th to close the
- GBP/USD is showing signs of stability above the 1.2600 handle, with Thursday’s bearish range being less than half of Wednesdays
- WTI crude oil is made a mediocre attempt to retest $70, but it looks vulnerable to another spike lower unless bullish momentum picks up soon. 68.95 is a key support level for bulls to defend, with next resistance levels sitting around 78.5 – 100 and 72.
- The FTSE 100 seems to be building a base above 7400, since a bullish pinbar respected the key level and prices are trying to break higher. If it can hold above the May 31st low ~7446 today, perhaps it can muster up the strength for another leg higher
- The DAX has managed to rise form the cycle lows, but it upside has underwhelmed and a double top has formed around 16,000 to warn of a reluctance to push higher immediately. Happy to step aside for now, with a break beneath 15897 risking a move below 15800.
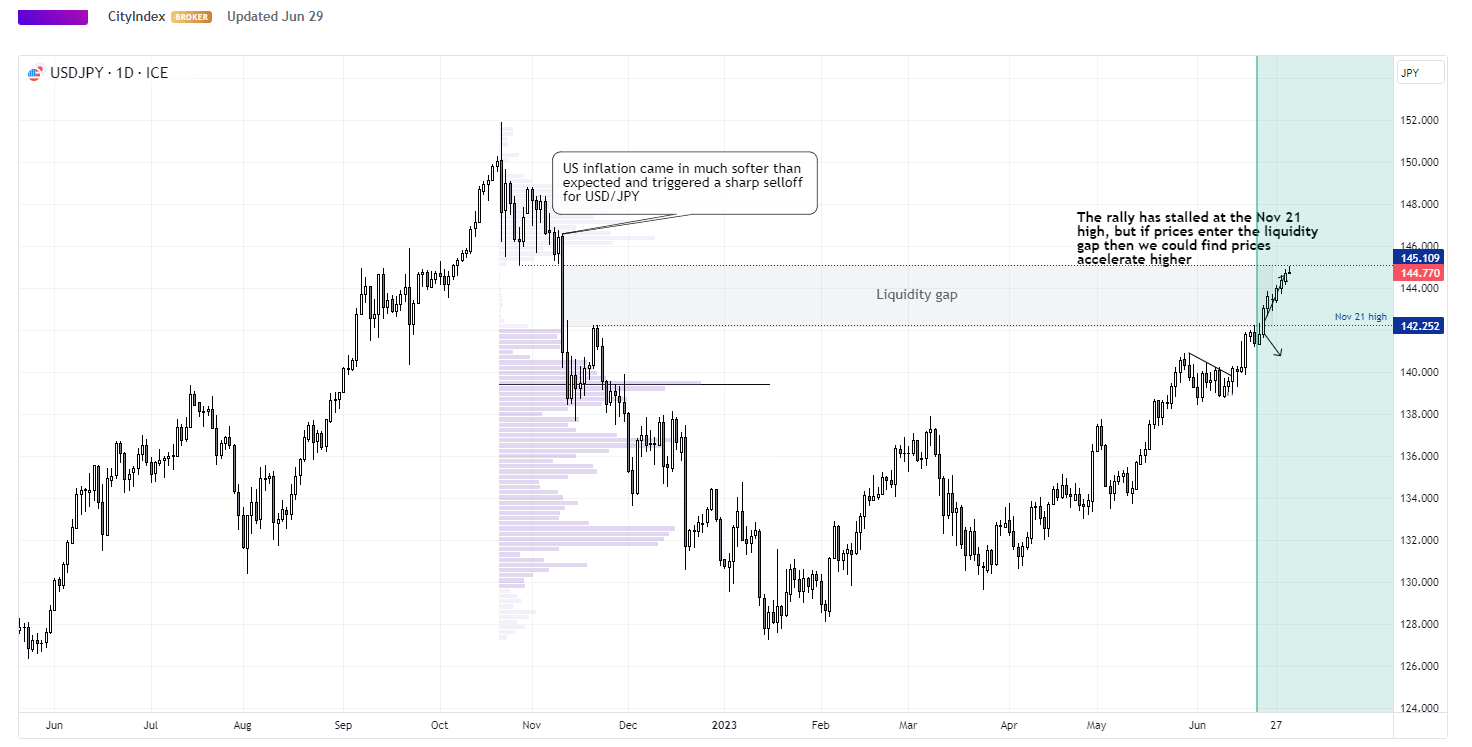
USD/JPY taps 145 despite risking risks of intervention
USD/JPY continued to rise overnight and taped 145 for the first time since November 2022. Toyo released softer inflation data ahead of the Tokyo which prompted the initial move higher, as it now seems likely that Japan’s nationwide inflation will lose steam in the July report.
It closed the liquidity gap we warned of a couple of weeks ago thanks to a combination of hawkish Fed comments, stronger US economic data, a dovish BOJ and lack of verbal intervention from Japan’s Ministry of Finance. But the higher this pair trades, the more likely it becomes that we’ll hear more comments form officials regarding yen volatility, in a bid to fend off speculators.
For now, it appears that bulls want another crack to break USD/JPY above 145.10, with bulls potentially seeking to buy dips around the 144.32 – 144.50 zone. But if ever this is a sign that some nervousness is appearing at these highs, it can be seen within the 25-day risk reversals, which shows put demand (downside protection) relative to call demand (upside bets) spiked as USD/JPY edged closer to 145.
Gold futures daily chart:


Traders remain net-long gold futures, although exposure has diminished alongside long exposure whilst prices have puled back from this year’s high. But it may be able to find some support around a volume cluster and bonce higher.
Whilst spot gold prices traded briefly below $1900 yesterday, the front-month gold futures contract did not. A bullish pinbar formed on the daily chart just above the big round $1900 level, and the day’s open-close range held above the volume cluster comprising of a weekly VPOC (volume point of control) and VPOC from the rally between 1813 – 2000.
Technically, I suspect gold it is due a bounce (even if only to be a correction against its bearish trend). Of course, what could help it treat 1900 like a springboard is if US PCE inflation data comes in much softer than expected later today, as traders would see it as less reason for the Fed to remain hawkish, to send short-term yields and US dollar lower.
But unless we see a strong rally from current level’s we would then seek evidence of a swing high below 1945 to see if it can eventually break beneath 1900. Whereas a direct break below 1900 invalidates the near-term bullish bias and brings 1867 into focus for bears.
View the full economic calendar
View the full economic calendar
-- Written by Matt Simpson
Follow Matt on Twitter @cLeverEdge
How to trade with City Index
You can trade with City Index by following these four easy steps:
- Open an account, or log in if you’re already a customer
• Open an account in the UK
• Open an account in Australia
• Open an account in Singapore
- Search for the market you want to trade in our award-winning platform
- Choose your position and size, and your stop and limit levels
- Place the trade
Related tags:
Latest market news




Open an account in minutes
Experience award-winning platforms with fast and secure execution, and enjoy tight spreads from 0.5 pts on FX and 0.3 pts on indices.
Economic calendar
Web Trader platform
Our sophisticated web-based platform is packed with features.
Related articles
Gold Outlook: XAU/USD hit hard as US yields, dollar resume ascent
A stronger dollar, surging front-end yields and renewed geopolitical tension have combined to push gold back towards key technical support.
EUR/USD weekly outlook: Oil, inflation and NFP in focus
After coming under significant pressure in recent weeks, the EUR/USD came off its lows to finish the week on a positive note on Friday, albeit with only a mild rebound. That was not enough to prevent the exchange rate falling for the third consecutive week, as the US dollar and bond yields rallied across the board.


USD/JPY Weekly Outlook: Payrolls loom as US rates remain the dominant driver
Strong US growth and hawkish Fed pricing continue to support USD/JPY, while intervention risk appears to be kicking in at lower levels
This report is intended for general circulation only. It should not be construed as a recommendation, or an offer (or solicitation of an offer) to buy or sell any financial products. The information provided does not take into account your specific investment objectives, financial situation or particular needs. Before you act on any recommendation that may be contained in this report, independent advice ought to be sought from a financial adviser regarding the suitability of the investment product, taking into account your specific investment objectives, financial situation or particular needs.
StoneX Financial Pte. Ltd., may distribute reports produced by its respective foreign entities or affiliates within the StoneX group of companies or third parties pursuant to an arrangement under Regulation 32C of the Financial Advisers Regulations. Where the report is distributed to a person in Singapore who is not an accredited investor, expert investor or an institutional investor (as defined in the Securities Futures Act), StoneX Financial Pte. Ltd. accepts legal responsibility to such persons for the contents of the report only to the extent required by law. Singapore recipients should contact StoneX Financial Pte. Ltd. at 6826 9988 for matters arising from, or in connection with the report.
In the case of all other recipients of this report, to the extent permitted by applicable laws and regulations neither StoneX Financial Pte. Ltd. nor its associated companies will be responsible or liable for any loss or damage incurred arising out of, or in connection with, any use of the information contained in this report and all such liability is hereby expressly disclaimed. No representation or warranty is made, express or implied, that the content of this report is complete or accurate.
StoneX Financial Pte. Ltd. is not under any obligation to update this report.
Trading CFDs carries a high level of risk that may not be suitable for some investors. Consider your investment objectives, level of experience, financial resources, risk appetite and other relevant circumstances carefully. The possibility exists that you could lose some or all of your investments, including your initial deposits. If in doubt, please seek independent expert advice. Visit www.forex.com/en-sg/terms-and-policies for the complete Risk Disclosure Statement.