



EURUSD, DXY Outlook: Head and Shoulders Breakout Risks?
EURUSD, DXY Outlook: As markets digest a dampened risk appetite due to escalating geopolitical tensions during US NFP week, head and shoulders formations are appearing on both EURUSD and DXY charts, raising breakout risks.
Share this:

Key Events This Week
- ISM PMIs: to clarify US economic activity (Tuesday–Thursday)
- US NFPs and their impact on rate cut expectations and DXY price action (Friday)
- Effects of US trade and legal developments, EU political shifts, and Middle East escalations on risk sentiment
Although the US Labor Day holiday is keeping US indices on hold, global markets are reacting to rising geopolitical tensions across the Middle East with Israel, between Russia and Ukraine, and with US tariff developments. These tensions have pulled risk appetite lower, holding indices below their record highs. Gold has approached its record high near 3,480, silver hit new 14-year highs above 40, and Bitcoin fell to 107,000 after previously reaching 125,000.
From a currency market perspective, concerns over Fed independence have further weakened confidence in the dollar, accelerating rate cut expectations and bearish dollar outlooks. Meanwhile, EU political risk is also rising, and bond yields have surged to historical highs:
- German 30-year yields are at a 14-year high of 3.36%
- UK 30-year yields have reached their highest since 1998, at 5.64%
This keeps EURUSD and GBPUSD in holding patterns against the DXY, unless US rate cut expectations trigger a further pullback in the dollar.
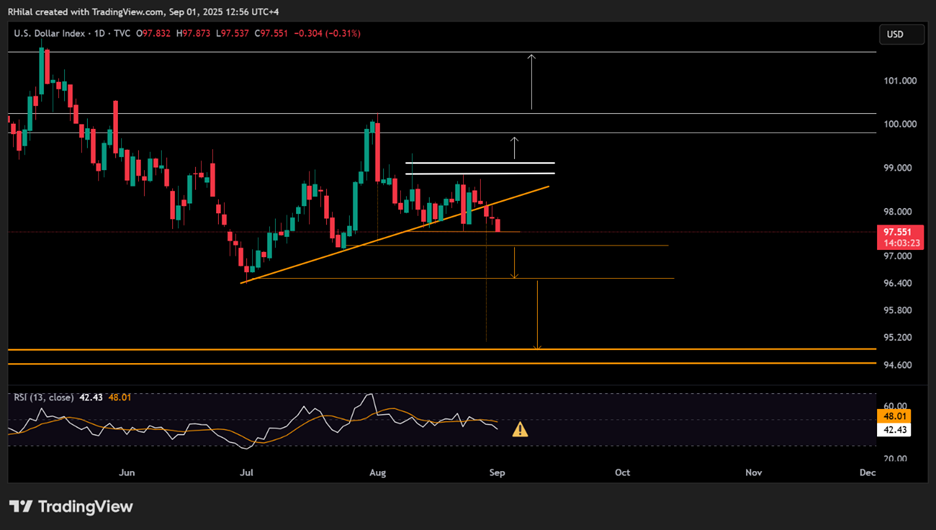
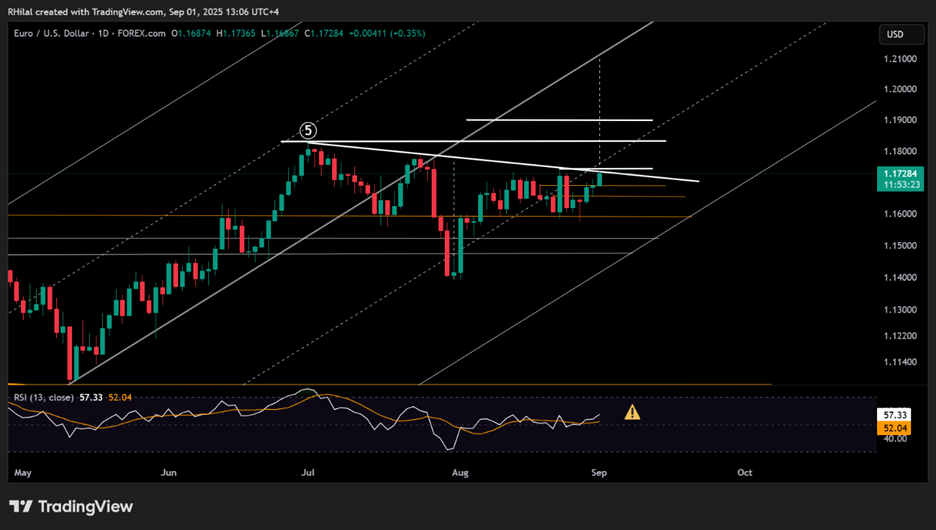
A notable head and shoulders continuation pattern is forming on both the EURUSD and DXY charts, suggesting possible extended bullish movement for the euro and further bearish pressure on the dollar.
Technical Analysis: Quantifying Uncertainty
DXY Outlook: Daily Time Frame – Log Scale
Source: Tradingview
The DXY rebound between July and August has shaped a head and shoulders pattern. The chart is now testing the downside breakout, with the daily RSI turning bearish and slipping below the 50 level. A clean break below the 97.50 support could extend losses toward 97.20 and 96.50, with the full head and shoulders pattern pointing to a potential move down toward the 95.00–94.50 zone.
On the upside, a rebound above the 98.00 level would suggest some bullish recovery. However, a sustained move above 100.20 is needed to confidently shift the outlook toward a longer-term bullish reversal.
EURUSD Outlook:Daily Time Frame – Log Scale
Source: Tradingview
On the flip side, EURUSD is holding at the neckline of a possible inverted head and shoulders formation. The daily RSI is accelerating above the 50 mark, supporting the bullish scenario. A key resistance to watch is 1.1740, above which gains may extend toward 1.1780 and 1.1830. A further breakout could confirm the bullish trend and open the path toward the 2021 highs between 1.20 and 1.23.
On the downside, if the pair pulls back below 1.1680, the next support levels are at 1.1650, 1.1570, 1.1520, and 1.1480 respectively.
Written by Razan Hilal, CMT
Follow on X: @Rh_waves
Related tags:


Open an account in minutes
Experience award-winning platforms with fast and secure execution, and enjoy tight spreads from 0.5 pts on FX and 0.3 pts on indices.
Economic calendar
Web Trader platform
Our sophisticated web-based platform is packed with features.
Related articles

Japanese Yen Forecast: USD/JPY 4% Rally Challenges Post-Intervention Downtrend 9 24 2026
USD/JPY momentum has shifted sharply higher, putting a major resistance confluence in focus as U.S. and Japanese event risk builds.


Oil Quietly Hands the Fed a Reason to Stay Hawkish
Oil prices and the U.S. dollar are both on the front foot as elevated energy costs feed Fed warnings that inflation may prove sticky.


USD/JPY outlook: Hawkish Fed recalibration pressures the yen
Stronger US growth momentum and rising Treasury yields are keeping USD/JPY pointed higher, even as Japanese policymakers try to limit the pressure building across domestic markets.

This report is intended for general circulation only. It should not be construed as a recommendation, or an offer (or solicitation of an offer) to buy or sell any financial products. The information provided does not take into account your specific investment objectives, financial situation or particular needs. Before you act on any recommendation that may be contained in this report, independent advice ought to be sought from a financial adviser regarding the suitability of the investment product, taking into account your specific investment objectives, financial situation or particular needs.
StoneX Financial Pte. Ltd., may distribute reports produced by its respective foreign entities or affiliates within the StoneX group of companies or third parties pursuant to an arrangement under Regulation 32C of the Financial Advisers Regulations. Where the report is distributed to a person in Singapore who is not an accredited investor, expert investor or an institutional investor (as defined in the Securities Futures Act), StoneX Financial Pte. Ltd. accepts legal responsibility to such persons for the contents of the report only to the extent required by law. Singapore recipients should contact StoneX Financial Pte. Ltd. at 6826 9988 for matters arising from, or in connection with the report.
In the case of all other recipients of this report, to the extent permitted by applicable laws and regulations neither StoneX Financial Pte. Ltd. nor its associated companies will be responsible or liable for any loss or damage incurred arising out of, or in connection with, any use of the information contained in this report and all such liability is hereby expressly disclaimed. No representation or warranty is made, express or implied, that the content of this report is complete or accurate.
StoneX Financial Pte. Ltd. is not under any obligation to update this report.
Trading CFDs carries a high level of risk that may not be suitable for some investors. Consider your investment objectives, level of experience, financial resources, risk appetite and other relevant circumstances carefully. The possibility exists that you could lose some or all of your investments, including your initial deposits. If in doubt, please seek independent expert advice. Visit www.forex.com/en-sg/terms-and-policies for the complete Risk Disclosure Statement.