





GBP/USD bulls eye move to 1.27: European open – Nov 27, 2023
GBP/USD has continued to take advantage of a weaker US dollar and rise to an 11-week high. And with a high level of volume activity overhead, we see the potential for a move to 1.27.
Share this:

Asian Indices:
- Australia's ASX 200 index fell by -45.8 points (-0.65%) and currently trades at 6,995.00
- Japan's Nikkei 225 index has fallen by -196.15 points (-0.58%) and currently trades at 33,429.38
- Hong Kong's Hang Seng index has fallen by -174.34 points (-0.99%) and currently trades at 17,385.08
- China's A50 Index has fallen by -176.55 points (-1.48%) and currently trades at 11,713.22
UK and European indices:
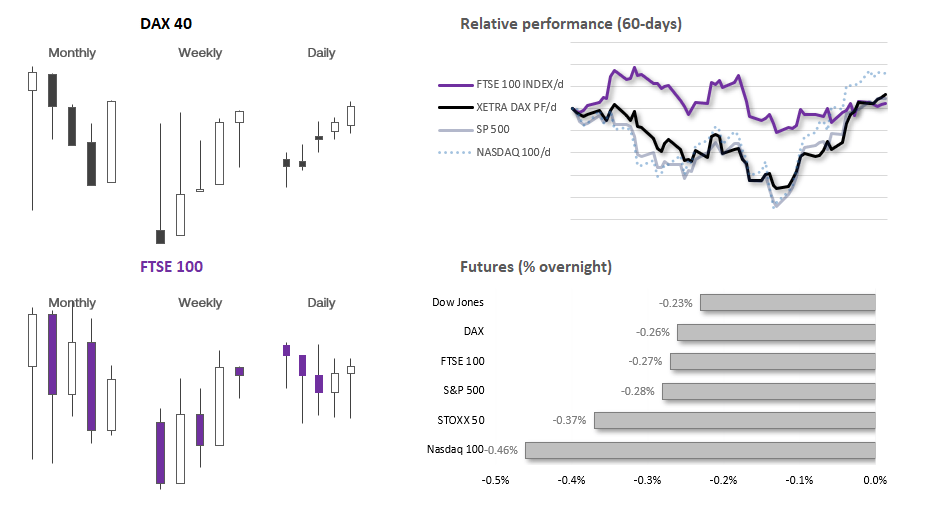
- UK's FTSE 100 futures are currently down -21 points (-0.28%), the cash market is currently estimated to open at 7,467.20
- Euro STOXX 50 futures are currently down -15 points (-0.34%), the cash market is currently estimated to open at 4,357.10
- Germany's DAX futures are currently down -41 points (-0.26%), the cash market is currently estimated to open at 15,988.49
US index futures:
- DJI futures are currently down -82 points (-0.23%)
- S&P 500 futures are currently down -13 points (-0.28%)
- Nasdaq 100 futures are currently down -72.75 points (-0.45%)
US bond yields gapped higher at the week’s open, to extend Friday’s gains. It was enough to knock sentiment at the start of the week and weigh on US index futures markets, and add to pressures for Chinese equity markets which were already under pressure following weak data from. Industrial profits fell -7.8% YTD in October.
We’re heading into the final few days of the month, which currently sees the US dollar as the weakest forex major with NZD/USD, AUD/USD and GBP/USD leading the way. For these classic risk-on tones to persist, we’d likely need to see a combination of slightly softer US data alongside another week of increased bond demand at this week’s auctions. Softer data plays nicely into the ‘Fed’s peak rate and 2024 cuts’ theme without fanning fears of an outright recession, which could actually see the dollar suck in safe haven flows and weigh on risk appetite. And if bond yields continue to move lower while investors step into the bond market, it could allow Wall Street to at least hold on to recent gains - if not extend them.
We don’t have any high-impact news scheduled for today, and with US traders returning to their desks with month-end flows in sight, we may find price action on the fickle side. Therefore we’d prefer to keep trading opportunities to intraday timeframes and seek smaller moves, or wait for longer-term swig trades to setup on the daily timeframe or above.
Events in focus (GMT):
- 11:00 – UK distributed traders survey (CBI)
- 13:00 – US building permits
- 13:10 – German Buba Balz speaks
- 14:00 – ECB’s Christine Lagarde speaks
- 15:00 – US home sales
- 15:30 – US Dallas Fed manufacturing business index
- 16:30 – US bond auctions (3-month, 6-month, 2-year, 10-year)
- 20:30 – COT report (Commitment of traders)
GBP/USD technical analysis (daily chart):
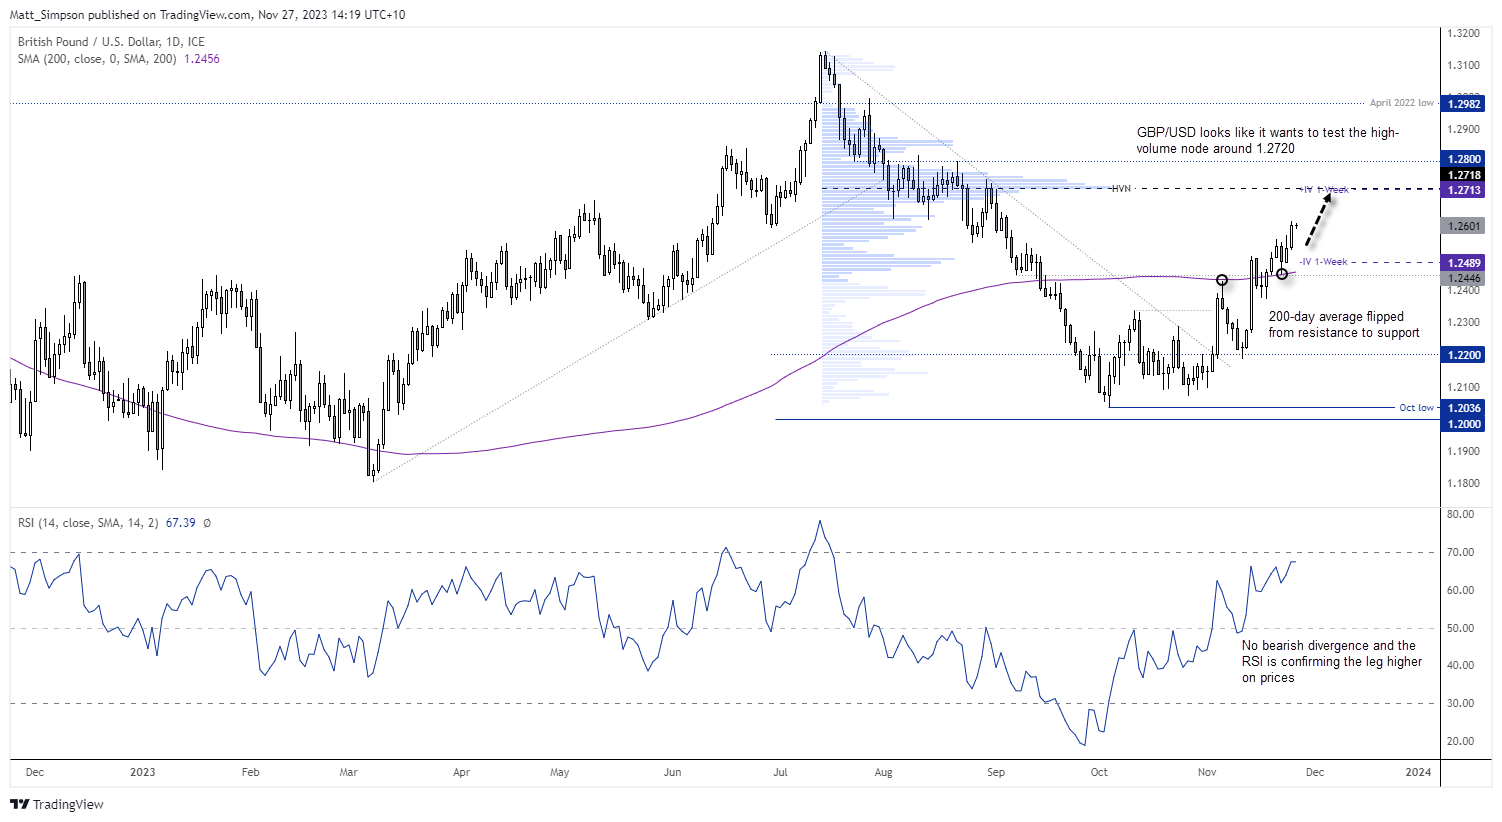
The British pound has continued to take advantage of the weaker US dollar, and rose to an 11-week high around 1.26. Support was found around the 200-day average on Wednesday ahead of its most recent leg higher, and as of yet there is no immediate sigs of a top forming. A slight bearish divergence is forming on RSI (2), yet RSI (14) continues to confirm the rise of prices with no bearish divergence, and it is yet to reach overbought (above 80).
With a strong bullish trend structure, I’m now looking for GBP/USD to extend its gains towards 1.2720 near the HVN (high volume node) from the bear move from the July high to October low. Incidentally, the upper 1-week implied volatility level lands right on the HVN, adding to its potential as a bullish target.
GBP/USD technical analysis (1-hour chart):
The 1-hour chart displays a nice bullish trend for GBP/USD, where volumes are rising as prices advance and diminish during period of consolidation or retracements. Prices are forming a potential bull flag whilst holding above the 10-hour EMA, and the RSI (14) is also confirming price action on this timeframe with no signs of a bearish divergence. The monthly R3 pivot is currently capping as resistance, but a break above last week’s high invalidates the level and assumes bullish continuation.
Should prices initially retrace lower, bulls could seek evidence of a swing low to anticipate its next leg higher.
View the full economic calendar
View the full economic calendar
-- Written by Matt Simpson
Follow Matt on Twitter @cLeverEdge
How to trade with City Index
You can trade with City Index by following these four easy steps:
- Open an account, or log in if you’re already a customer
• Open an account in the UK
• Open an account in Australia
• Open an account in Singapore
- Search for the market you want to trade in our award-winning platform
- Choose your position and size, and your stop and limit levels
- Place the trade
Related tags:


Open an account in minutes
Experience award-winning platforms with fast and secure execution, and enjoy tight spreads from 0.5 pts on FX and 0.3 pts on indices.
Economic calendar
Web Trader platform
Our sophisticated web-based platform is packed with features.
Related articles
AUD/USD hammered by US yields and fading RBA hike bets
US yields, dollar strength and fading RBA hike bets have combined to drive AUD/USD to fresh multi-month lows. The macro and technical bias remains bearish, although history suggests parts of the move are now reaching unusually stretched levels.

Japanese Yen Outlook: USD/JPY, GBP/JPY, AUD/JPY Setups
USD/JPY and GBP/JPY show signs of stabilising, while AUD/JPY remains vulnerable as yen crosses deliver mixed technical signals.

EUR/USD Forecast: Euro Struggles to Find Support Even After U.S. PCE Data
The euro continues to face a challenging environment in the short term. The currency has struggled to regain ground against a U.S. dollar that remains firmly supported, a dynamic reflected in EUR/USD, which has now recorded three consecutive losing sessions and a decline of roughly 0.6%.

This report is intended for general circulation only. It should not be construed as a recommendation, or an offer (or solicitation of an offer) to buy or sell any financial products. The information provided does not take into account your specific investment objectives, financial situation or particular needs. Before you act on any recommendation that may be contained in this report, independent advice ought to be sought from a financial adviser regarding the suitability of the investment product, taking into account your specific investment objectives, financial situation or particular needs.
StoneX Financial Pte. Ltd., may distribute reports produced by its respective foreign entities or affiliates within the StoneX group of companies or third parties pursuant to an arrangement under Regulation 32C of the Financial Advisers Regulations. Where the report is distributed to a person in Singapore who is not an accredited investor, expert investor or an institutional investor (as defined in the Securities Futures Act), StoneX Financial Pte. Ltd. accepts legal responsibility to such persons for the contents of the report only to the extent required by law. Singapore recipients should contact StoneX Financial Pte. Ltd. at 6826 9988 for matters arising from, or in connection with the report.
In the case of all other recipients of this report, to the extent permitted by applicable laws and regulations neither StoneX Financial Pte. Ltd. nor its associated companies will be responsible or liable for any loss or damage incurred arising out of, or in connection with, any use of the information contained in this report and all such liability is hereby expressly disclaimed. No representation or warranty is made, express or implied, that the content of this report is complete or accurate.
StoneX Financial Pte. Ltd. is not under any obligation to update this report.
Trading CFDs carries a high level of risk that may not be suitable for some investors. Consider your investment objectives, level of experience, financial resources, risk appetite and other relevant circumstances carefully. The possibility exists that you could lose some or all of your investments, including your initial deposits. If in doubt, please seek independent expert advice. Visit www.forex.com/en-sg/terms-and-policies for the complete Risk Disclosure Statement.