






Gold Technical Analysis: Technical Tuesday – April 15, 2025
In this edition of Technical Tuesday, I will provide gold technical analysis and look at various time frames to highlight how the metal has become significantly overbought with prices continuing to trade near record highs that have been created repeatedly in recent months. Still, unless we observe a clear reversal pattern, any technical indications of overheating prices should be taken with a pinch of salt.
Share this:

- Gold Technical Analysis: Strong momentum vs. overbought conditions - key dilemma
- Monthly XAU/USD chart has not been this overbought since the pandemic
- Gold trading strategy: dip-buying still preferred but caution warranted
Gold has had an amazing run, thanks to central bank buying, strong haven demand, weakness in US dollar, inflation hedging and momentum buying, among many other fundamental reasons. While there are no signs to suggest that this strong bullish trend is about to turn, you can’t help but feel that, with trade war concerns easing ever so slightly, haven demand might ease a little. In this edition of Technical Tuesday, I will provide gold technical analysis and look at various time frames to highlight how the metal has become significantly overbought with prices continuing to trade near record highs that have been created repeatedly in recent months. Still, unless we observe a clear reversal pattern, any technical indications of overheating prices should be taken with a pinch of salt.
Strong Momentum vs. Overbought Conditions - Key Dilemma for Gold Traders
Let’s cut to the chase. While gold remains in a very strong bullish trend, there are growing technical signs that the rally may be overextended, at least in the short term. Several momentum indicators are starting to push very deep into overstretched territory, not least the Relative Strength Index (RSI). But therein lies the dilemma. Gold’s momentum indicators are at extreme overbought levels for a reason: strong buying pressure. Why, then, would you try to pick the top in gold prices, you might be wondering. Well, I am not. Not yet anyway. The whole point of this gold technical analysis article is twofold. First, to highlight the risks of chasing this rally, without first witnessing a pullback in gold prices. Second, to highlight the potential for gold to top out soon, which the bears could take advantage of when confirmed.
Gold technical Analysis: Key support levels on daily chart
On the daily time frame, the RSI touched 70.0 as gold broke to a new record peak of $3,245 on Friday. This is a threshold that traditionally denotes overbought conditions. While this doesn’t necessarily imply an immediate reversal, it’s often a precursor to sideways movement or a short-term pullback. If we do see a short-term pullback, then the first level of support to watch is at $3,167, marking the previous all-time high from early April. A further dip could test the $3,100 level, while the $3,000–$3,022 range marks a critical zone, encompassing both the short-term uptrend line and a psychologically significant level. Below that, $2,956 stands out as a major pivot. A break beneath could open the door to a deeper retracement toward the long-term support zone around $2,790.
Monthly XAU/USD chart has not been this overbought since the pandemic
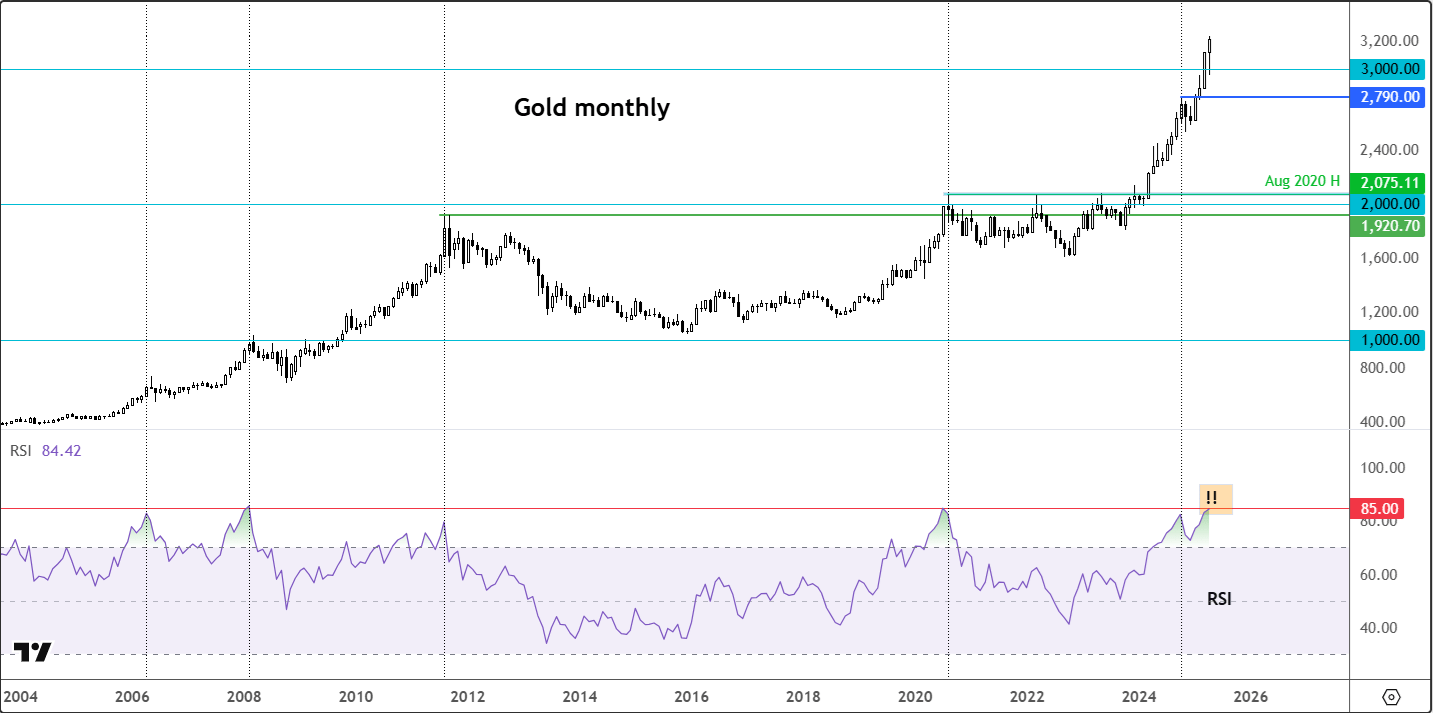
What's more telling is the longer-term picture. The monthly RSI has been perched above the overbought zone since April 2024 and is now nudging close to 85.0. Historically, this level has preceded major consolidations or reversals—seen most recently in October 2023 and previously during the peaks in 2011 and the pandemic-era highs. Those events were followed by cooling-off periods in the price of gold ranging from several weeks to several months.
What about the weekly time frame?
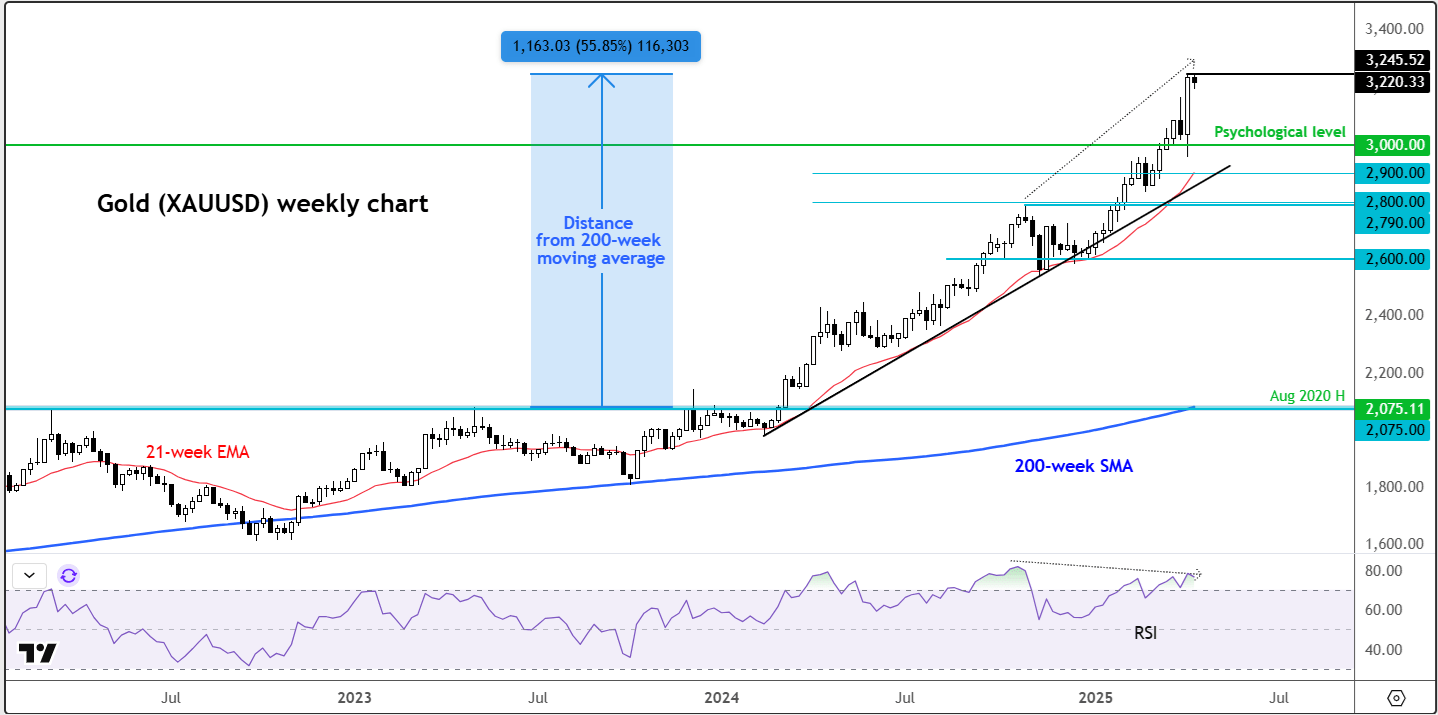
Well, the weekly RSI is also raising eyebrows, currently hovering above 75. Again, not necessarily a screaming sell signal, but certainly a flashing yellow light. RSI divergence—where prices make new highs but RSI does not—is another warning signal to be wary of. This is evidenced both on the daily and weekly RSI indicators.
On this weekly time frame, another metric worth noting is gold’s divergence from its 200-week moving average. Prices are trading around a huge $1,150 above this long-term mean, which in percentage terms is 55% higher. Such a gap is rare and often unsustainable unless supported by powerful macroeconomic drivers—which, to be fair, the current environment does offer. Nonetheless, mean reversion is a powerful force.
So, how would you trade gold?
A key reversal candle pattern on the daily or weekly chart, plus some downside follow-through, would be the clearest technical signal to watch, which would indicate a reversal in the trend. That said, for now, at least, bullish trend-following traders still have the upper hand. Unless we start seeing lower highs and lower lows, any dip is likely to be viewed as a buying opportunity. But I can’t stress this point enough in this gold technical analysis article: caution is warranted as the rally enters its more mature phase.
Source for all charts used in this article: TradingView.com
-- Written by Fawad Razaqzada, Market Analyst
Follow Fawad on Twitter @Trader_F_R
How to trade with City Index
You can trade with City Index by following these four easy steps:
- Open an account, or log in if you’re already a customer
• Open an account in the UK
• Open an account in Australia
• Open an account in Singapore
- Search for the company you want to trade in our award-winning platform
- Choose your position and size, and your stop and limit levels
- Place the trade
Related tags:
Latest market news




Open an account in minutes
Experience award-winning platforms with fast and secure execution, and enjoy tight spreads from 0.5 pts on FX and 0.3 pts on indices.
Economic calendar
Web Trader platform
Our sophisticated web-based platform is packed with features.
Related articles

Oil Quietly Hands the Fed a Reason to Stay Hawkish
Oil prices and the U.S. dollar are both on the front foot as elevated energy costs feed Fed warnings that inflation may prove sticky.

S&P 500 forecast: Stocks extend drop as correction risks grow
US and global equity markets have extended Wednesday’s sell-off, with Wall Street opening lower after a weak handover from Asia and Europe. The deterioration in risk appetite has been spreading across global markets. The dollar was firmer, Treasury yields were holding onto yesterday’s gains, while gold, silver and bitcoin were all under pressure alongside equities and major currencies.

Gold forecast: XAU/USD could take a larger dive after the big rise in yields
Gold prices have been falling in the last few days after last week’s post-FOMC pop faded amid rising interest rate expectations, higher oil prices and a strengthening US dollar. As before, I wasn’t convinced gold would thrive in the current macro backdrop.
This report is intended for general circulation only. It should not be construed as a recommendation, or an offer (or solicitation of an offer) to buy or sell any financial products. The information provided does not take into account your specific investment objectives, financial situation or particular needs. Before you act on any recommendation that may be contained in this report, independent advice ought to be sought from a financial adviser regarding the suitability of the investment product, taking into account your specific investment objectives, financial situation or particular needs.
StoneX Financial Pte. Ltd., may distribute reports produced by its respective foreign entities or affiliates within the StoneX group of companies or third parties pursuant to an arrangement under Regulation 32C of the Financial Advisers Regulations. Where the report is distributed to a person in Singapore who is not an accredited investor, expert investor or an institutional investor (as defined in the Securities Futures Act), StoneX Financial Pte. Ltd. accepts legal responsibility to such persons for the contents of the report only to the extent required by law. Singapore recipients should contact StoneX Financial Pte. Ltd. at 6826 9988 for matters arising from, or in connection with the report.
In the case of all other recipients of this report, to the extent permitted by applicable laws and regulations neither StoneX Financial Pte. Ltd. nor its associated companies will be responsible or liable for any loss or damage incurred arising out of, or in connection with, any use of the information contained in this report and all such liability is hereby expressly disclaimed. No representation or warranty is made, express or implied, that the content of this report is complete or accurate.
StoneX Financial Pte. Ltd. is not under any obligation to update this report.
Trading CFDs carries a high level of risk that may not be suitable for some investors. Consider your investment objectives, level of experience, financial resources, risk appetite and other relevant circumstances carefully. The possibility exists that you could lose some or all of your investments, including your initial deposits. If in doubt, please seek independent expert advice. Visit www.forex.com/en-sg/terms-and-policies for the complete Risk Disclosure Statement.