



S&P500 easy money gone - what happens next ?
A quiet start to the new trading week as U.S stock markets closed mixed ahead of this week's FOMC and Q2 GDP data and earnings reports from U.S Mega Tech companies.
Share this:

A quiet start to the new trading week as U.S stock markets closed mixed ahead of this week's FOMC and Q2 GDP data and earnings reports from U.S Mega Tech companies.
The run of softer-than-expected leading data, including the global flash PMI’s, has raised the odds of recession from 33% to 40%. However, in the latest episode of where “bad economic news is good news”, evidence of a sharp loss of economic momentum has flowed through into lower interest rates and inflationary expectations.
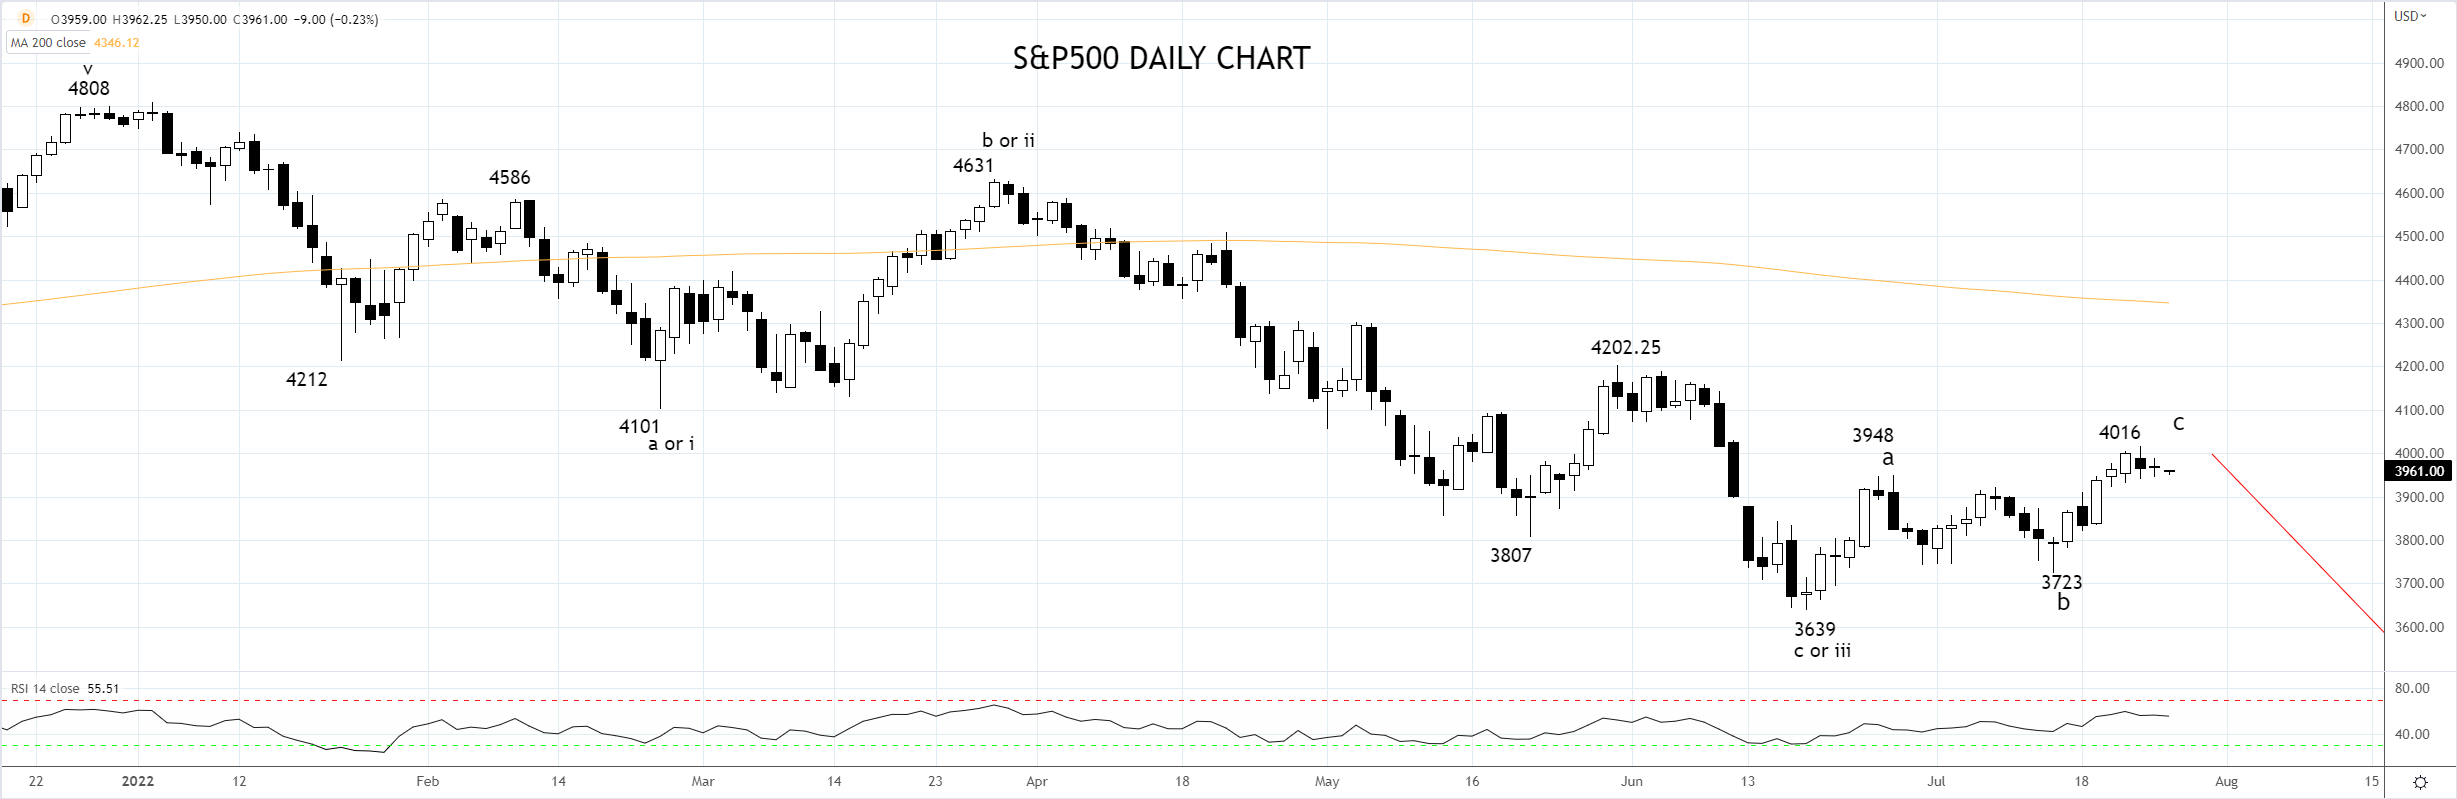
This combination has helped the S&P500 to all but reach the 4050 level we have been targeting since late June here. The "easy money" from the rally from June lows is now gone and raises the question of what happens next?
The first thing to note is that volatility will likely rise in the coming days, and following the FOMC meeting, Q2 GDP will be released later that day. The market is looking for a modest rise in Q2 GDP of 0.5%. However, the partial data has been soft, and a second consecutive negative GDP print is possible, which fits one of the technical criteria used to define a recession.
Another point to note is that the initial post-FOMC reaction is frequently reversed in the very next session. The reversal could result from positioning heading into the FOMC or investors having more time to review the nuances of the accompanying messaging.
Presuming the initial reaction for U.S stock markets is for a relief rally after the FOMC, a sell-off may well follow, particularly if the Fed remains hawkish and fails to acknowledge the slowdown in data which would inflame recessionary fears. Further to this point, the bellwether U.S equity market the S&P500 is now well off its June lows, and there is room to move to the downside.
On the other hand, should a more dovish messaging come out of the FOMC meeting, it would be a significant development and likely the catalyst for a more substantial rally - one that I suspect investors would be quick to embrace.
Turning to the charts, the rally from the June 3639 low continues to appear corrective or countertrend. Providing the S&P500 does not extend above resistance at 4200/20, the downtrend is expected to resume.
Source Tradingview. The figures stated are as of July 25th, 2022. Past performance is not a reliable indicator of future performance. This report does not contain and is not to be taken as containing any financial product advice or financial product recommendation
How to trade with City Index
You can trade with City Index by following these four easy steps:
- Open an account, or log in if you’re already a customer
• Open an account in the UK
• Open an account in Australia
• Open an account in Singapore
- Search for the company you want to trade in our award-winning platform
- Choose your position and size, and your stop and limit levels
- Place the trade
A quiet start to the new trading week as U.S stock markets closed mixed ahead of this week's FOMC and Q2 GDP data and earnings reports from U.S Mega Tech companies.
The run of softer-than-expected leading data, including the global flash PMI’s, has raised the odds of recession from 33% to 40%. However, in the latest episode of where “bad economic news is good news”, evidence of a sharp loss of economic momentum has flowed through into lower interest rates and inflationary expectations.
This combination has helped the S&P500 to all but reach the 4050 level we have been targeting since late June here. The "easy money" from the rally from June lows is now gone and raises the question of what happens next?
The first thing to note is that volatility will likely rise in the coming days, and following the FOMC meeting, Q2 GDP will be released later that day. The market is looking for a modest rise in Q2 GDP of 0.5%. However, the partial data has been soft, and a second consecutive negative GDP print is possible, which fits one of the technical criteria used to define a recession.
Another point to note is that the initial post-FOMC reaction is frequently reversed in the very next session. The reversal could result from positioning heading into the FOMC or investors having more time to review the nuances of the accompanying messaging.
Presuming the initial reaction for U.S stock markets is for a relief rally after the FOMC, a sell-off may well follow, particularly if the Fed remains hawkish and fails to acknowledge the slowdown in data which would inflame recessionary fears. Further to this point, the bellwether U.S equity market the S&P500 is now well off its June lows, and there is room to move to the downside.
On the other hand, should a more dovish messaging come out of the FOMC meeting, it would be a significant development and likely the catalyst for a more substantial rally - one that I suspect investors would be quick to embrace.
Turning to the charts, the rally from the June 3639 low continues to appear corrective or countertrend. Providing the S&P500 does not extend above resistance at 4200/20, the downtrend is expected to resume.
Source Tradingview. The figures stated are as of July 25th, 2022. Past performance is not a reliable indicator of future performance. This report does not contain and is not to be taken as containing any financial product advice or financial product recommendation
- Open a Forex.com account, or log in if you’re already a customer.
- Search for the pair you want to trade in our award-winning platform.
- Choose your position and size, and your stop and limit levels.
- Place the trade.
Related tags:



Open an account in minutes
Experience award-winning platforms with fast and secure execution, and enjoy tight spreads from 0.5 pts on FX and 0.3 pts on indices.
Economic calendar
Web Trader platform
Our sophisticated web-based platform is packed with features.
Related articles

NZD/USD pressure mounts as payrolls looms large
NZD/USD has fallen sharply as Fed rate expectations reset higher, but extreme downside stretch and major support raise the risk of a violent counter-trend rebound.


EUR/USD Update: Will Fed Expectations Keep Pressure on the Euro?
The week continues to present challenges for the euro's short-term strength. This is reflected in the recent performance of EUR/USD, which has declined by nearly 0.6% over the last three trading sessions


NZD/USD: US yield advantage keeps pressure on the Kiwi
NZD/USD has become unusually sensitive to relative front-end rates, with the US two-year yield advantage now near historically extreme levels.
This report is intended for general circulation only. It should not be construed as a recommendation, or an offer (or solicitation of an offer) to buy or sell any financial products. The information provided does not take into account your specific investment objectives, financial situation or particular needs. Before you act on any recommendation that may be contained in this report, independent advice ought to be sought from a financial adviser regarding the suitability of the investment product, taking into account your specific investment objectives, financial situation or particular needs.
StoneX Financial Pte. Ltd., may distribute reports produced by its respective foreign entities or affiliates within the StoneX group of companies or third parties pursuant to an arrangement under Regulation 32C of the Financial Advisers Regulations. Where the report is distributed to a person in Singapore who is not an accredited investor, expert investor or an institutional investor (as defined in the Securities Futures Act), StoneX Financial Pte. Ltd. accepts legal responsibility to such persons for the contents of the report only to the extent required by law. Singapore recipients should contact StoneX Financial Pte. Ltd. at 6826 9988 for matters arising from, or in connection with the report.
In the case of all other recipients of this report, to the extent permitted by applicable laws and regulations neither StoneX Financial Pte. Ltd. nor its associated companies will be responsible or liable for any loss or damage incurred arising out of, or in connection with, any use of the information contained in this report and all such liability is hereby expressly disclaimed. No representation or warranty is made, express or implied, that the content of this report is complete or accurate.
StoneX Financial Pte. Ltd. is not under any obligation to update this report.
Trading CFDs carries a high level of risk that may not be suitable for some investors. Consider your investment objectives, level of experience, financial resources, risk appetite and other relevant circumstances carefully. The possibility exists that you could lose some or all of your investments, including your initial deposits. If in doubt, please seek independent expert advice. Visit www.forex.com/en-sg/terms-and-policies for the complete Risk Disclosure Statement.