



After a perfect storm in Q2 will the S&P500 rebound in Q3?
U.S stock markets are on track to lock in their worst first-half performance in decades. The S&P500 is currently down over 15% in the second quarter and on track to lock in an ~20% decline for the first half of the year.
Share this:

U.S stock markets are on track to lock in their worst first-half performance in decades. The S&P500 is currently down over 15% in the second quarter and on track to lock in an ~20% decline for the first half of the year.
Amongst the gloom, flickers of peak Fed Rate interest rate hike expectations and inflation are burning a little brighter after events overnight.
On a panel discussion in Portugal, Fed Chair Powell reiterated the Fed will do what it takes to get inflation down. He also noted that market pricing is "pretty well aligned with where we're going".
Currently, the interest rate market is almost fully priced for a 75bp rate hike at the July 27/28 FOMC, which would take the Fed Funds to a range of 2.25-2.50%.
Another 110bp of hikes are then priced over the final three meetings of 2022, taking the terminal rate to the 3.35%- 3.60% range. Critically 50bp of rate cuts then appear from May 2023 until December 2023.
Elsewhere mixed inflation data in Europe has raised hopes (again) an inflation inflexion point is nearing. German CPI was lower than expected (Harmonised inflation printed at 8.2% YoY vs expectations for an 8.8% rise). On the other hand, Spanish CPI was higher, rising by 10% YoY vs expectations for an 8.7% rise.
As a reminder, higher interest rates, higher inflation, and growth concerns have been behind the rerating lower equities in 2022. However, before getting carried away on prospects of a Q3 rally, a new headwind will soon begin to blow.
As noted by analysts at Goldman Sachs, "Profit margins for the median S&P 500 company will likely decline next year whether or not the economy falls into recession." And "while investors are focused on the possibility of recession, the equity market does not appear to be fully reflecting the downside risks to earnings."
Traditionally, analysts' earnings revisions lag in both bull markets and in bear markets. Downside earnings revisions appear set to become the next challenge for U.S equities, just as other headwinds are easing.
What do the charts say?
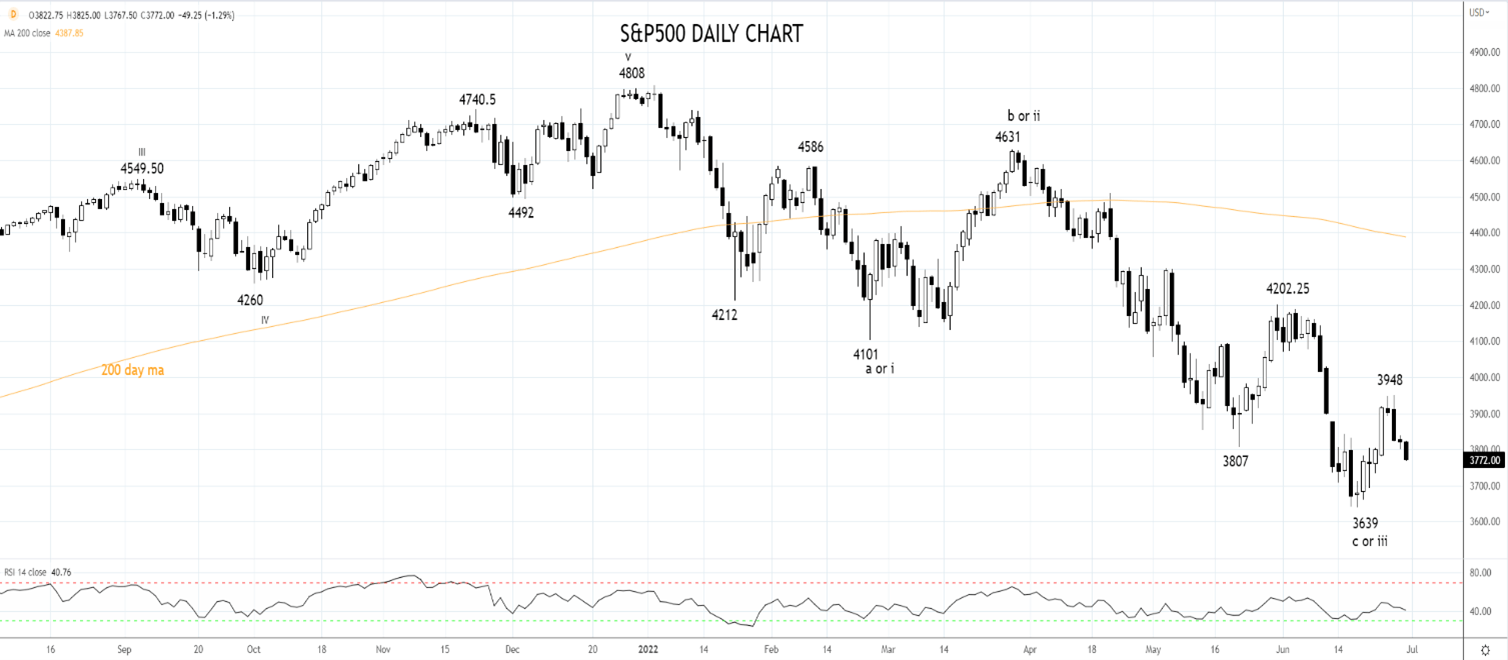
Despite the rally from the mid-June 3639 low stalling earlier this week at 3950, we are not quite ready to give up on the current countertrend rally extending towards the 4000/4100 resistance zone.
Providing a potential rally does not extend above resistance at 4200/20 coming from the late May, and early June highs, it will be viewed as a short-covering rally with scope to retest the June lows.
Source Tradingview. The figures stated are as of June 30th 2022. Past performance is not a reliable indicator of future performance. This report does not contain and is not to be taken as containing any financial product advice or financial product recommendation
How to trade with City Index
You can trade with City Index by following these four easy steps:
- Open an account, or log in if you’re already a customer
• Open an account in the UK
• Open an account in Australia
• Open an account in Singapore
- Search for the company you want to trade in our award-winning platform
- Choose your position and size, and your stop and limit levels
- Place the trade
U.S stock markets are on track to lock in their worst first-half performance in decades. The S&P500 is currently down over 15% in the second quarter and on track to lock in an ~20% decline for the first half of the year.
Amongst the gloom, flickers of peak Fed Rate interest rate hike expectations and inflation are burning a little brighter after events overnight.
On a panel discussion in Portugal, Fed Chair Powell reiterated the Fed will do what it takes to get inflation down. He also noted that market pricing is "pretty well aligned with where we're going".
Currently, the interest rate market is almost fully priced for a 75bp rate hike at the July 27/28 FOMC, which would take the Fed Funds to a range of 2.25-2.50%.
Another 110bp of hikes are then priced over the final three meetings of 2022, taking the terminal rate to the 3.35%- 3.60% range. Critically 50bp of rate cuts then appear from May 2023 until December 2023.
Elsewhere mixed inflation data in Europe has raised hopes (again) an inflation inflexion point is nearing. German CPI was lower than expected (Harmonised inflation printed at 8.2% YoY vs expectations for an 8.8% rise). On the other hand, Spanish CPI was higher, rising by 10% YoY vs expectations for an 8.7% rise.
As a reminder, higher interest rates, higher inflation, and growth concerns have been behind the rerating lower equities in 2022. However, before getting carried away on prospects of a Q3 rally, a new headwind will soon begin to blow.
As noted by analysts at Goldman Sachs, "Profit margins for the median S&P 500 company will likely decline next year whether or not the economy falls into recession." And "while investors are focused on the possibility of recession, the equity market does not appear to be fully reflecting the downside risks to earnings."
Traditionally, analysts' earnings revisions lag in both bull markets and in bear markets. Downside earnings revisions appear set to become the next challenge for U.S equities, just as other headwinds are easing.
What do the charts say?
Despite the rally from the mid-June 3639 low stalling earlier this week at 3950, we are not quite ready to give up on the current countertrend rally extending towards the 4000/4100 resistance zone.
Providing a potential rally does not extend above resistance at 4200/20 coming from the late May, and early June highs, it will be viewed as a short-covering rally with scope to retest the June lows.
Source Tradingview. The figures stated are as of June 30th 2022. Past performance is not a reliable indicator of future performance. This report does not contain and is not to be taken as containing any financial product advice or financial product recommendation
- Open a Forex.com account, or log in if you’re already a customer.
- Search for the pair you want to trade in our award-winning platform.
- Choose your position and size, and your stop and limit levels.
- Place the trade.
Related tags:




Open an account in minutes
Experience award-winning platforms with fast and secure execution, and enjoy tight spreads from 0.5 pts on FX and 0.3 pts on indices.
Economic calendar
Web Trader platform
Our sophisticated web-based platform is packed with features.
Related articles

ASX 200 Slides as Oil, Yields and Rate Risks Hit Sentiment
The ASX 200 suffered its worst week in six months as surging oil, higher bond yields and renewed rate-hike bets drove a broad risk-off move.

Nikkei 225 Eyes Wall Street Bounce Ahead of NFP
Wall Street rebounds as Fed hike bets ease, while Nikkei 225 futures eye 66k resistance ahead of US nonfarm payrolls.

Nasdaq 100 Braces for Nvidia Earnings, Jackson Hole and Volatility
Nvidia earnings and Jackson Hole put Nasdaq 100 volatility in focus, with technical signals and historical returns pointing to a pivotal week.
This report is intended for general circulation only. It should not be construed as a recommendation, or an offer (or solicitation of an offer) to buy or sell any financial products. The information provided does not take into account your specific investment objectives, financial situation or particular needs. Before you act on any recommendation that may be contained in this report, independent advice ought to be sought from a financial adviser regarding the suitability of the investment product, taking into account your specific investment objectives, financial situation or particular needs.
StoneX Financial Pte. Ltd., may distribute reports produced by its respective foreign entities or affiliates within the StoneX group of companies or third parties pursuant to an arrangement under Regulation 32C of the Financial Advisers Regulations. Where the report is distributed to a person in Singapore who is not an accredited investor, expert investor or an institutional investor (as defined in the Securities Futures Act), StoneX Financial Pte. Ltd. accepts legal responsibility to such persons for the contents of the report only to the extent required by law. Singapore recipients should contact StoneX Financial Pte. Ltd. at 6826 9988 for matters arising from, or in connection with the report.
In the case of all other recipients of this report, to the extent permitted by applicable laws and regulations neither StoneX Financial Pte. Ltd. nor its associated companies will be responsible or liable for any loss or damage incurred arising out of, or in connection with, any use of the information contained in this report and all such liability is hereby expressly disclaimed. No representation or warranty is made, express or implied, that the content of this report is complete or accurate.
StoneX Financial Pte. Ltd. is not under any obligation to update this report.
Trading CFDs carries a high level of risk that may not be suitable for some investors. Consider your investment objectives, level of experience, financial resources, risk appetite and other relevant circumstances carefully. The possibility exists that you could lose some or all of your investments, including your initial deposits. If in doubt, please seek independent expert advice. Visit www.forex.com/en-sg/terms-and-policies for the complete Risk Disclosure Statement.