


Nasdaq 100 Braces for Nvidia Earnings, Jackson Hole and Volatility
Nvidia earnings and Jackson Hole put Nasdaq 100 volatility in focus, with technical signals and historical returns pointing to a pivotal week.
Share this:

The next major test for the AI trade and Nasdaq 100 arrives after the close on Wednesday, as Nvidia (NVDA) reports fiscal Q2 earnings.
Wall Street expects another sharp increase in revenue, driven predominantly by demand from Nvidia’s data centre business. But with expectations already elevated, the reaction to guidance could matter more than the headline numbers themselves. Traders will pay particular attention to commentary around Blackwell, Rubin and AI infrastructure spending.
With Nvidia earnings historically producing a sharp rise in volatility, and Fed Chair Kevin Warsh due to speak at Jackson Hole on Friday, the Nasdaq 100 could be in for a lively end to the week.
View related analysis:
View related analysis:
Nvidia Earnings and Jackson Hole Put Nasdaq 100 Volatility in Focus
Nvidia (NVD) Technical Analysis
While the longer-term charts show a clear uptrend for one of Wall Street’s favourite stocks, which threatens to break to new highs in due course, it has met some resistance in recent months.
A gravestone doji formed in June, and the subsequent selloff in July could mark the third candle of an evening star formation. If August closes around current levels, Nvidia is also on track to form a shooting star reversal beneath its all-time high. A bearish engulfing candle marks a lower high on the weekly chart, further underscoring the potential for a pullback over the coming weeks or months.
That said, Nvidia has fallen for seven consecutive days — its most bearish such sequence since March — which suggests a bounce could be incoming. Also note the slight bullish divergence on the daily RSI (2) in its oversold zone. A positive earnings report could provide the catalyst, although traders also need to factor in the Jackson Hole symposium, with Fed Chair Kevin Warsh speaking on Friday.
But with bearish clues on the weekly and higher timeframes, Nvidia may need to break above the August high, or even its record high, to dispel concerns of a deeper pullback.
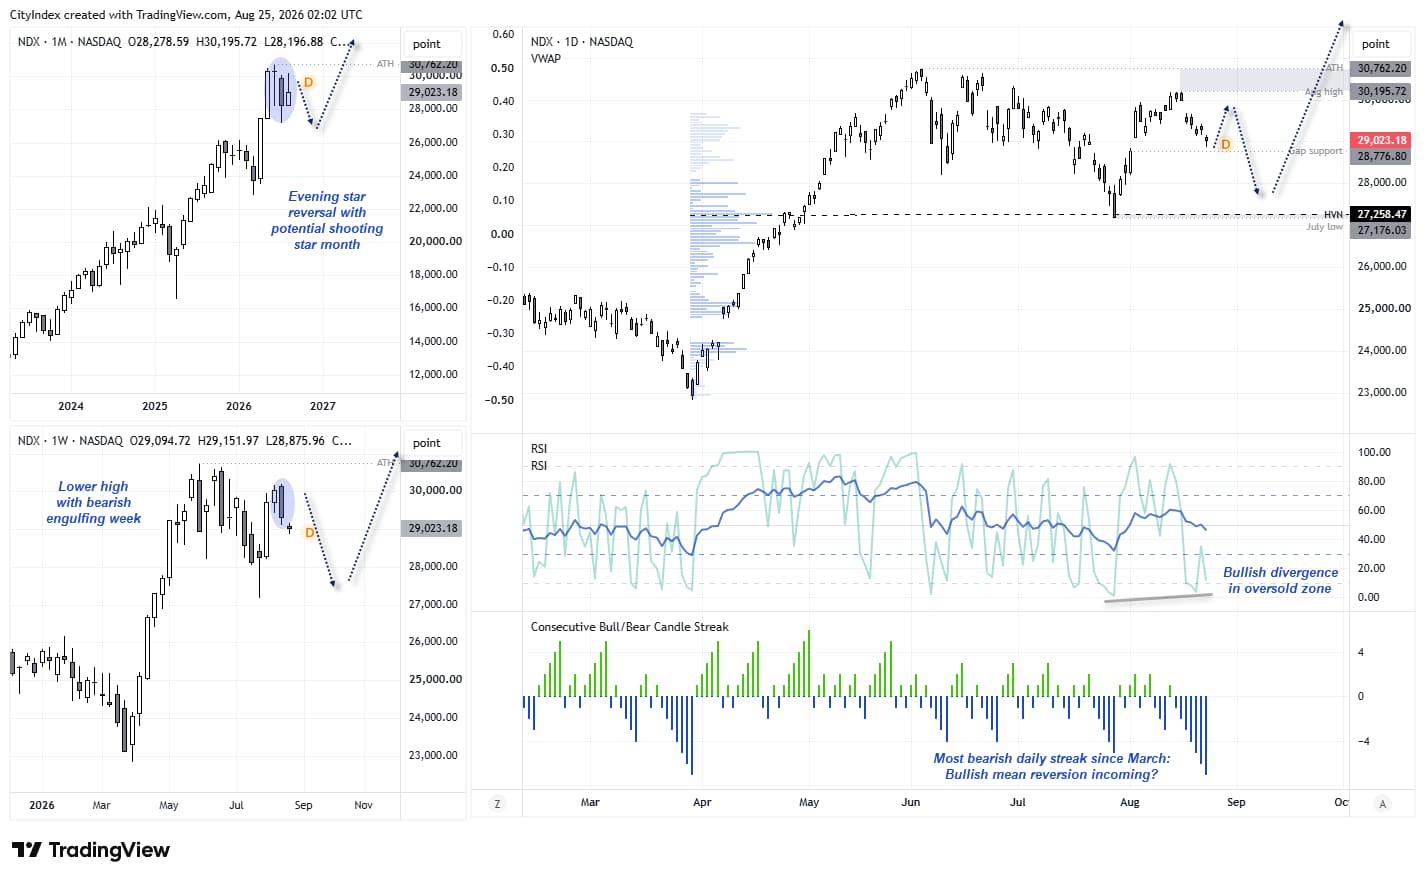
Source: NASDAQ, TradingView
Nvidia Earnings Signal Higher Volatility, but Recent Returns Turn Bearish
Nvidia earnings have historically produced a sharp increase in volatility, with the average post-earnings daily range rising to around 6% and several sessions exceeding 10%. Average returns are also positive on the first full session after earnings, although the median is much lower, showing that a handful of outsized rallies have lifted the mean.
More recently, however, the pattern has turned bearish. Nvidia has fallen on the first full trading day after each of its past four earnings reports, despite the longer-term average showing a positive bias. That makes the current setup particularly interesting: history points to elevated volatility, but recent price action warns against assuming that another earnings beat will automatically translate into a higher share price.
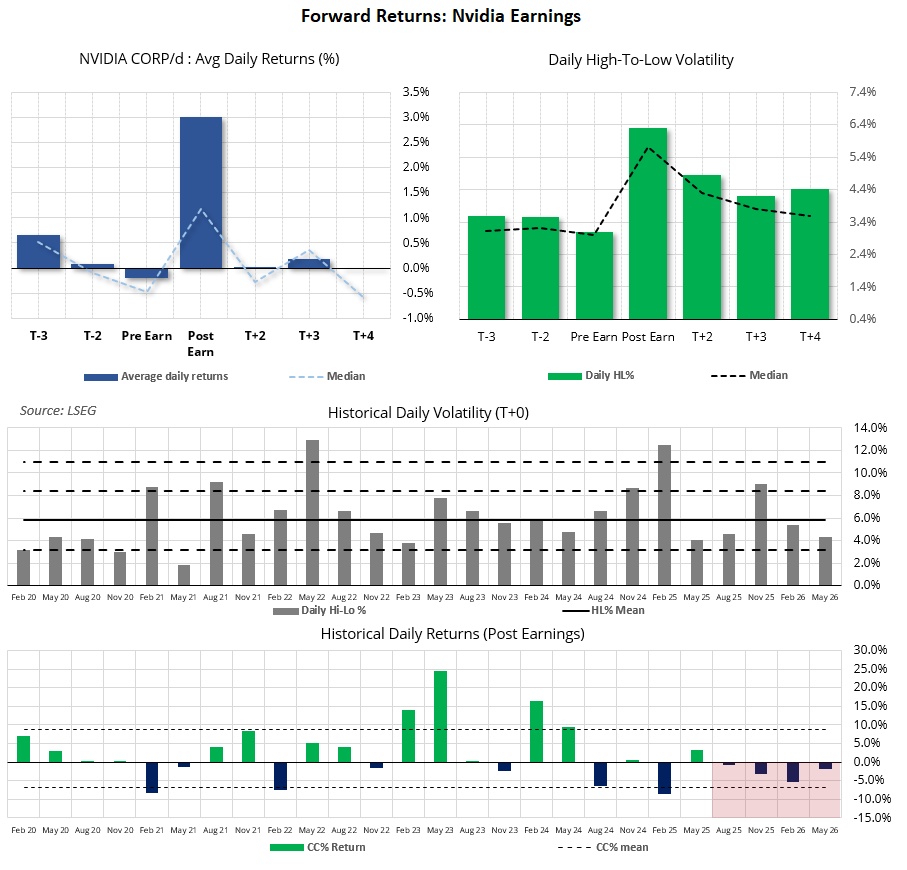
Source: NASDAQ, LSEG
This content was created by an affiliate of FOREX.com and represents the views and opinions of the author/speakers, not the views and opinions of FOREX.com, StoneX Group Inc., or its subsidiaries. The content has not been independently reviewed by FOREX.com.
Nasdaq 100 Futures (NQ) Technical Analysis
We cannot really talk about Nvidia without considering its impact on the Nasdaq, given their tight correlation. The two markets have a strong relationship, with positive correlations above 0.9 over the 10- and 290-day periods, although that relationship has been less stable in recent months, with the 60-day correlation dropping to 0.47.
Their weekly and daily charts also look strikingly similar, which makes the Nasdaq 100 another market to watch when assessing the broader Nvidia theme.

Source: LSEG
Nasdaq 100 Technical Analysis: Bulls Eye 30k, Bears Watch 28k
The daily chart of Nasdaq 100 futures shows the monthly pivot point at 28,721, which could provide potential support. The same bullish divergence is also present on the RSI (2) in the oversold zone. Prices are respecting the weekly S1 pivot for now, so perhaps a low has been seen, although the monthly pivot is also worth keeping in mind below.
A potential near-term upside target for bulls sits around the weekly pivot point and high-volume node (HVN) near 29,600, a break above which brings 30k into focus just beneath the weekly R1 pivot and prior swing highs.
But if bears are lurking — and I suspect they just might be — these resistance levels could also provide areas to fade into. If they get their way, the 28k area could come back into focus near a historical weekly VPOC.
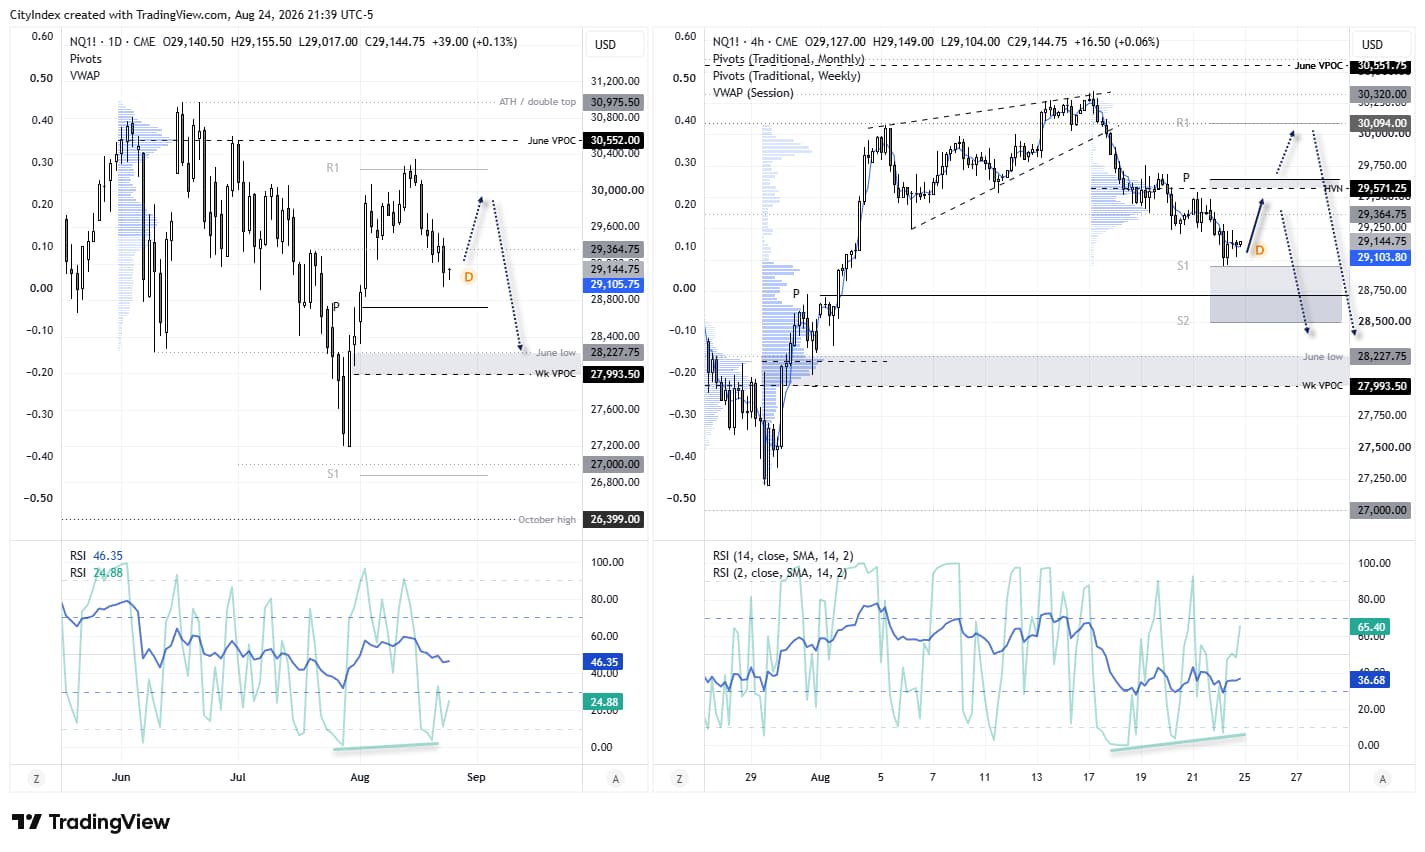
Source: ICE, TradingView



Open an account in minutes
Experience award-winning platforms with fast and secure execution, and enjoy tight spreads from 0.5 pts on FX and 0.3 pts on indices.
Economic calendar
Web Trader platform
Our sophisticated web-based platform is packed with features.
Related articles

AUD/USD and AUD/JPY Tease Swing Highs Heading into Jobs Report
AUD/USD and AUD/JPY show signs of potential swing highs as bearish reversal candles emerge ahead of Australia's employment report.

Canadian Dollar Short-term Outlook: USD/CAD Five-Week Rally Hits a Wall at Major Resistance 10 14 2026
USD/CAD is holding near fresh yearly highs, but bearish divergence and a well-defined October range raise the stakes at major resistance.


Stocks on Watch After CPI-Fueled Breakdown: SPX, Nasdaq, NVDA
Coming into the week there was an early case of divergence as AI and tech had started to show lag behind the S&P. That shift is growing more noticeable following a higher-than-expected CPI print.

This report is intended for general circulation only. It should not be construed as a recommendation, or an offer (or solicitation of an offer) to buy or sell any financial products. The information provided does not take into account your specific investment objectives, financial situation or particular needs. Before you act on any recommendation that may be contained in this report, independent advice ought to be sought from a financial adviser regarding the suitability of the investment product, taking into account your specific investment objectives, financial situation or particular needs.
StoneX Financial Pte. Ltd., may distribute reports produced by its respective foreign entities or affiliates within the StoneX group of companies or third parties pursuant to an arrangement under Regulation 32C of the Financial Advisers Regulations. Where the report is distributed to a person in Singapore who is not an accredited investor, expert investor or an institutional investor (as defined in the Securities Futures Act), StoneX Financial Pte. Ltd. accepts legal responsibility to such persons for the contents of the report only to the extent required by law. Singapore recipients should contact StoneX Financial Pte. Ltd. at 6826 9988 for matters arising from, or in connection with the report.
In the case of all other recipients of this report, to the extent permitted by applicable laws and regulations neither StoneX Financial Pte. Ltd. nor its associated companies will be responsible or liable for any loss or damage incurred arising out of, or in connection with, any use of the information contained in this report and all such liability is hereby expressly disclaimed. No representation or warranty is made, express or implied, that the content of this report is complete or accurate.
StoneX Financial Pte. Ltd. is not under any obligation to update this report.
Trading CFDs carries a high level of risk that may not be suitable for some investors. Consider your investment objectives, level of experience, financial resources, risk appetite and other relevant circumstances carefully. The possibility exists that you could lose some or all of your investments, including your initial deposits. If in doubt, please seek independent expert advice. Visit www.forex.com/en-sg/terms-and-policies for the complete Risk Disclosure Statement.