



Stocks on Watch After CPI-Fueled Breakdown: SPX, Nasdaq, NVDA
Coming into the week there was an early case of divergence as AI and tech had started to show lag behind the S&P. That shift is growing more noticeable following a higher-than-expected CPI print.
Share this:

Stocks, SPX, Nasdaq, NVDA Talking Points:
- After holding a big spot of support yesterday, S&P 500 futures are showing a bearish engulf on the daily, as of this writing.
- Another key spot of support is in-play from a prior swing high for the S&P, but perhaps more important is the shift under the surface, where former high-flyers like NVDA have started to show lag.
I looked into this in the five charts for this week video, but the bearish engulf on the weekly chart of NVDA from last week was disconcerting. Perhaps more telling was the mismatch from the fundamental backdrop, where a massive buyback announcement of $235b has, effectively, brought little net interest to the long side of the stock. The full video is below, and there I was able to elaborate in greater detail how this countered an otherwise bullish backdrop for both the Nasdaq and S&P 500.
NVDA Bearish Engulfing Spells Trouble for AI Stocks
This content was created by an affiliate of FOREX.com and represents the views and opinions of the author/speakers, not the views and opinions of FOREX.com, StoneX Group Inc., or its subsidiaries. The content has not been independently reviewed by FOREX.com.
S&P 500
From the daily chart there’s a big spot of support that’s in-play, and as I’ve looked at in the past, it’s been the late-week rallies that have been most noticeable in stocks. So, there could still be a case for bulls here especially if we see some buying interest ahead of today’s close. For bears, however, they would probably want to be more tactical if honing in on the S&P, or, they could look elsewhere, like the Nasdaq or NVDA to try to harness relative weakness elsewhere.
S&P 500 Futures Daily Chart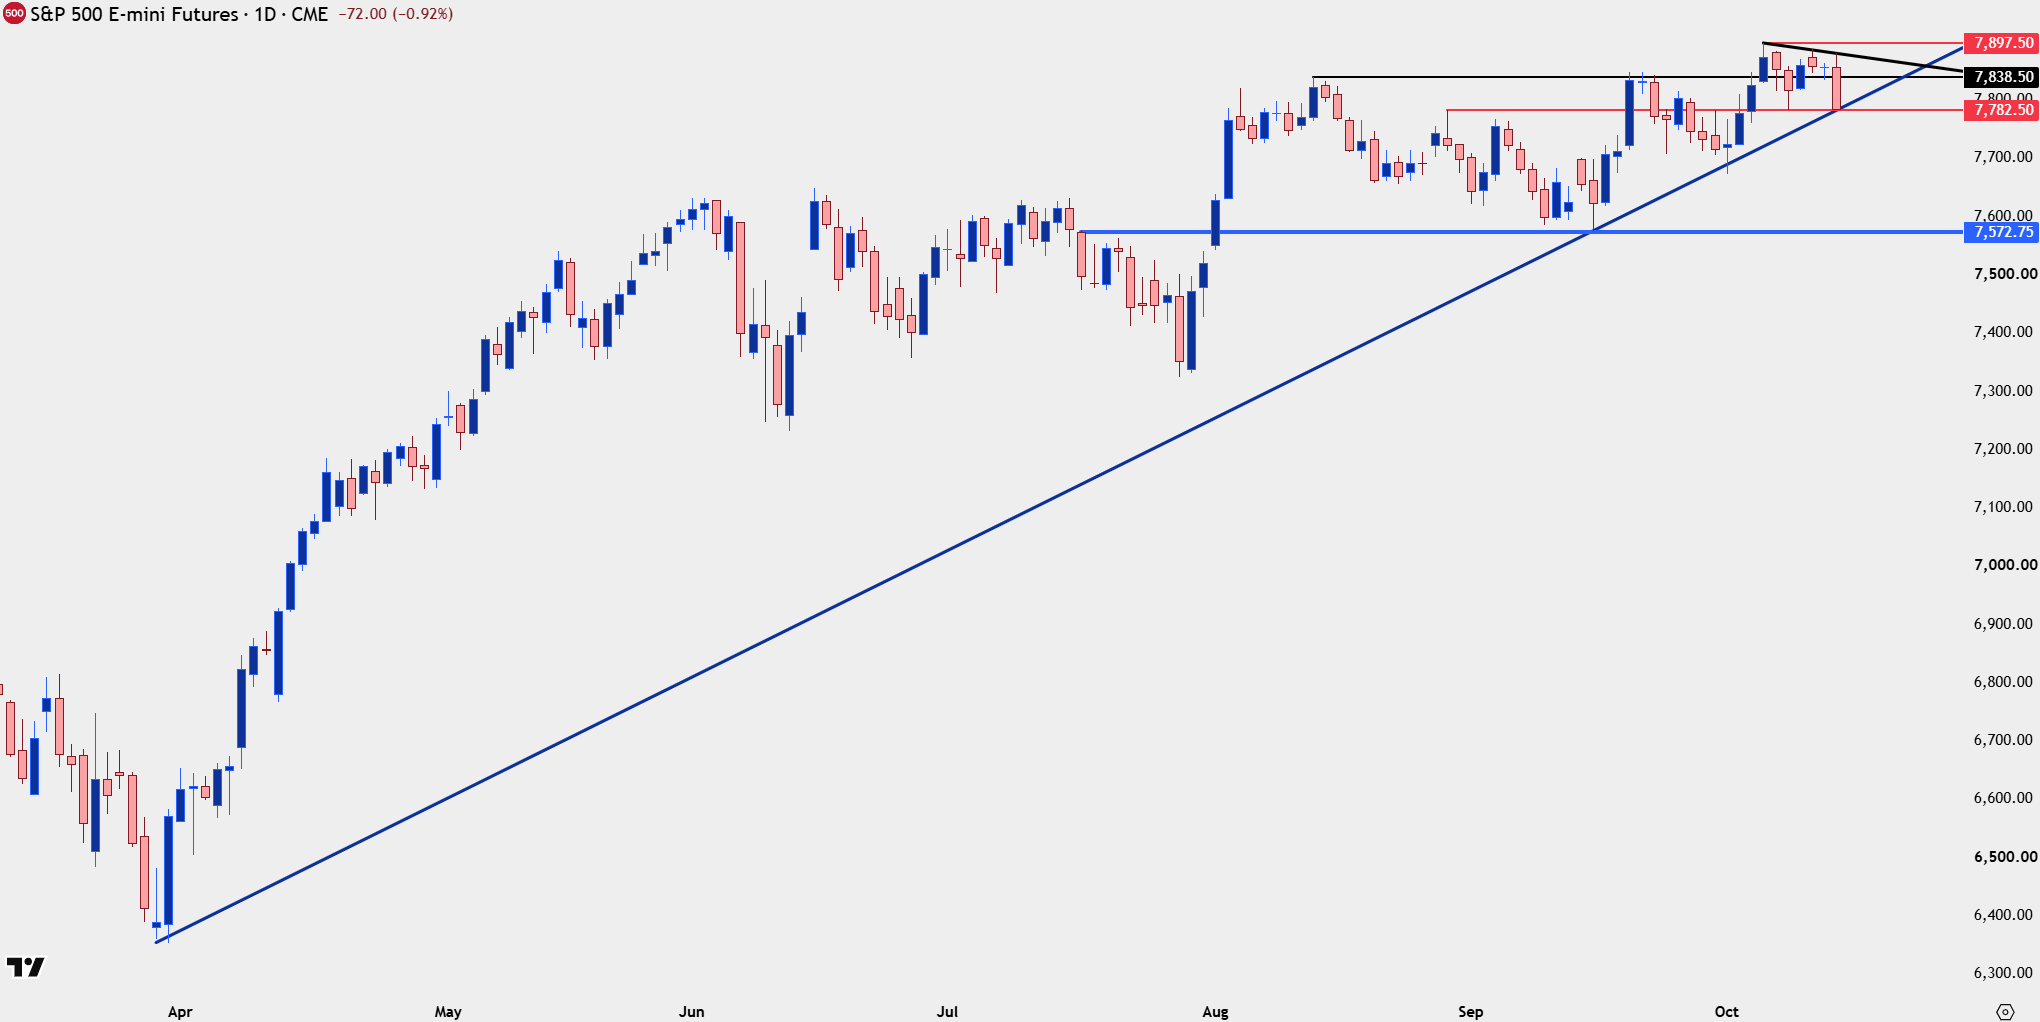
Chart prepared by James Stanley; data derived from Tradingview
S&P 500 Shorter-Term
Coming into the day there was a notable bounce from a big spot on the chart, but since the CPI print, bears have taken a huge swing. As noted above, sellers would likely want to take a tactical approach here and given that prior support structure, there’s a couple of spots where lower-high resistance could play.
The 7798-7808 zone sits just overhead, and above that, it’s the 7838-7848 zone that was in-play twice earlier this week before the breakdown this morning. In between the two, which I’d consider as an ‘r2’ area of resistance right now, is 7822.
S&P 500 30-Minute Chart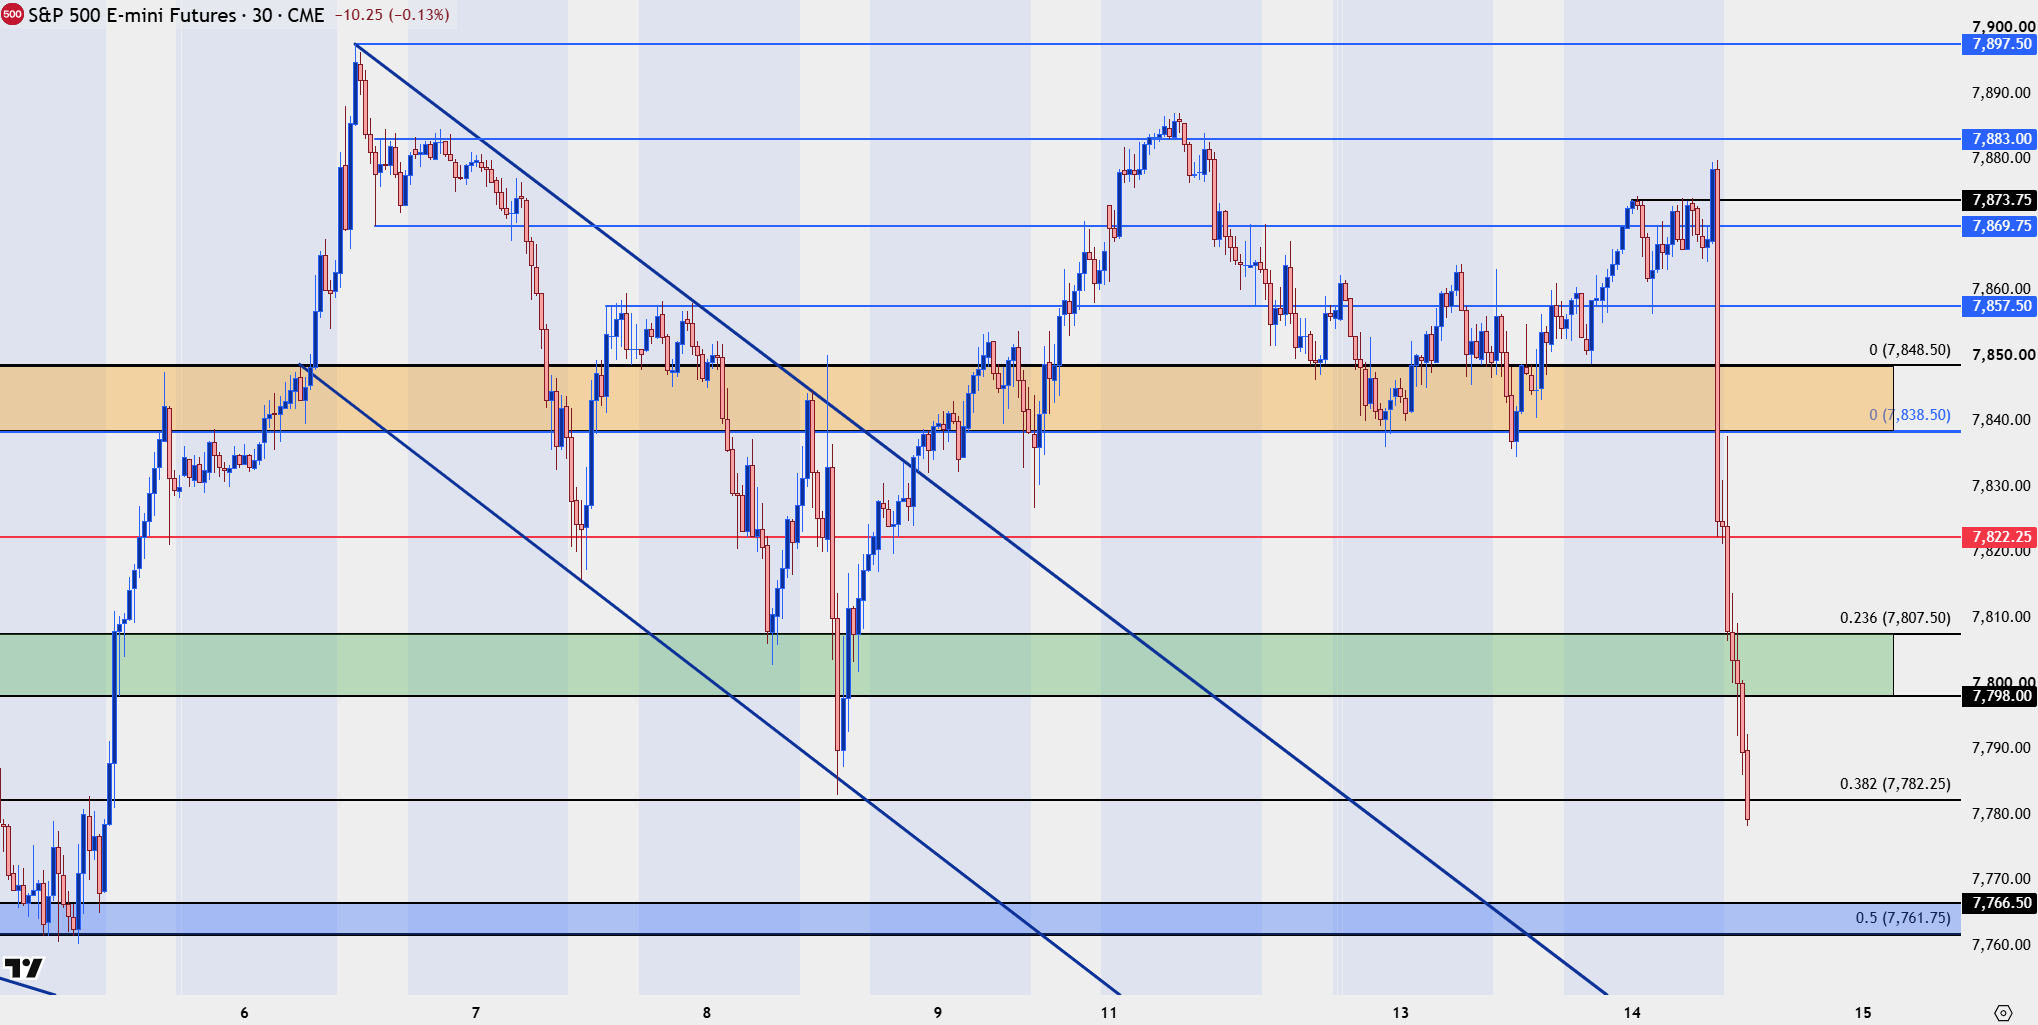
Chart prepared by James Stanley; data derived from Tradingview
Nasdaq
In the above linked video I had highlighted how the Friday rally in the S&P 500 wasn’t quite mirrored in the Nasdaq, although, at the time, there was still a bullish case that could be made as there was support showing at prior resistance.
That has since shifted and the Nasdaq is breaking down, setting a fresh monthly low (almost fresh two month lows) and testing the price that had held support three times in late-September.
Below this, the 30k level is a major spot that hasn’t been in-play since the post-Fed breakout/rally.
Nasdaq 100 Daily Chart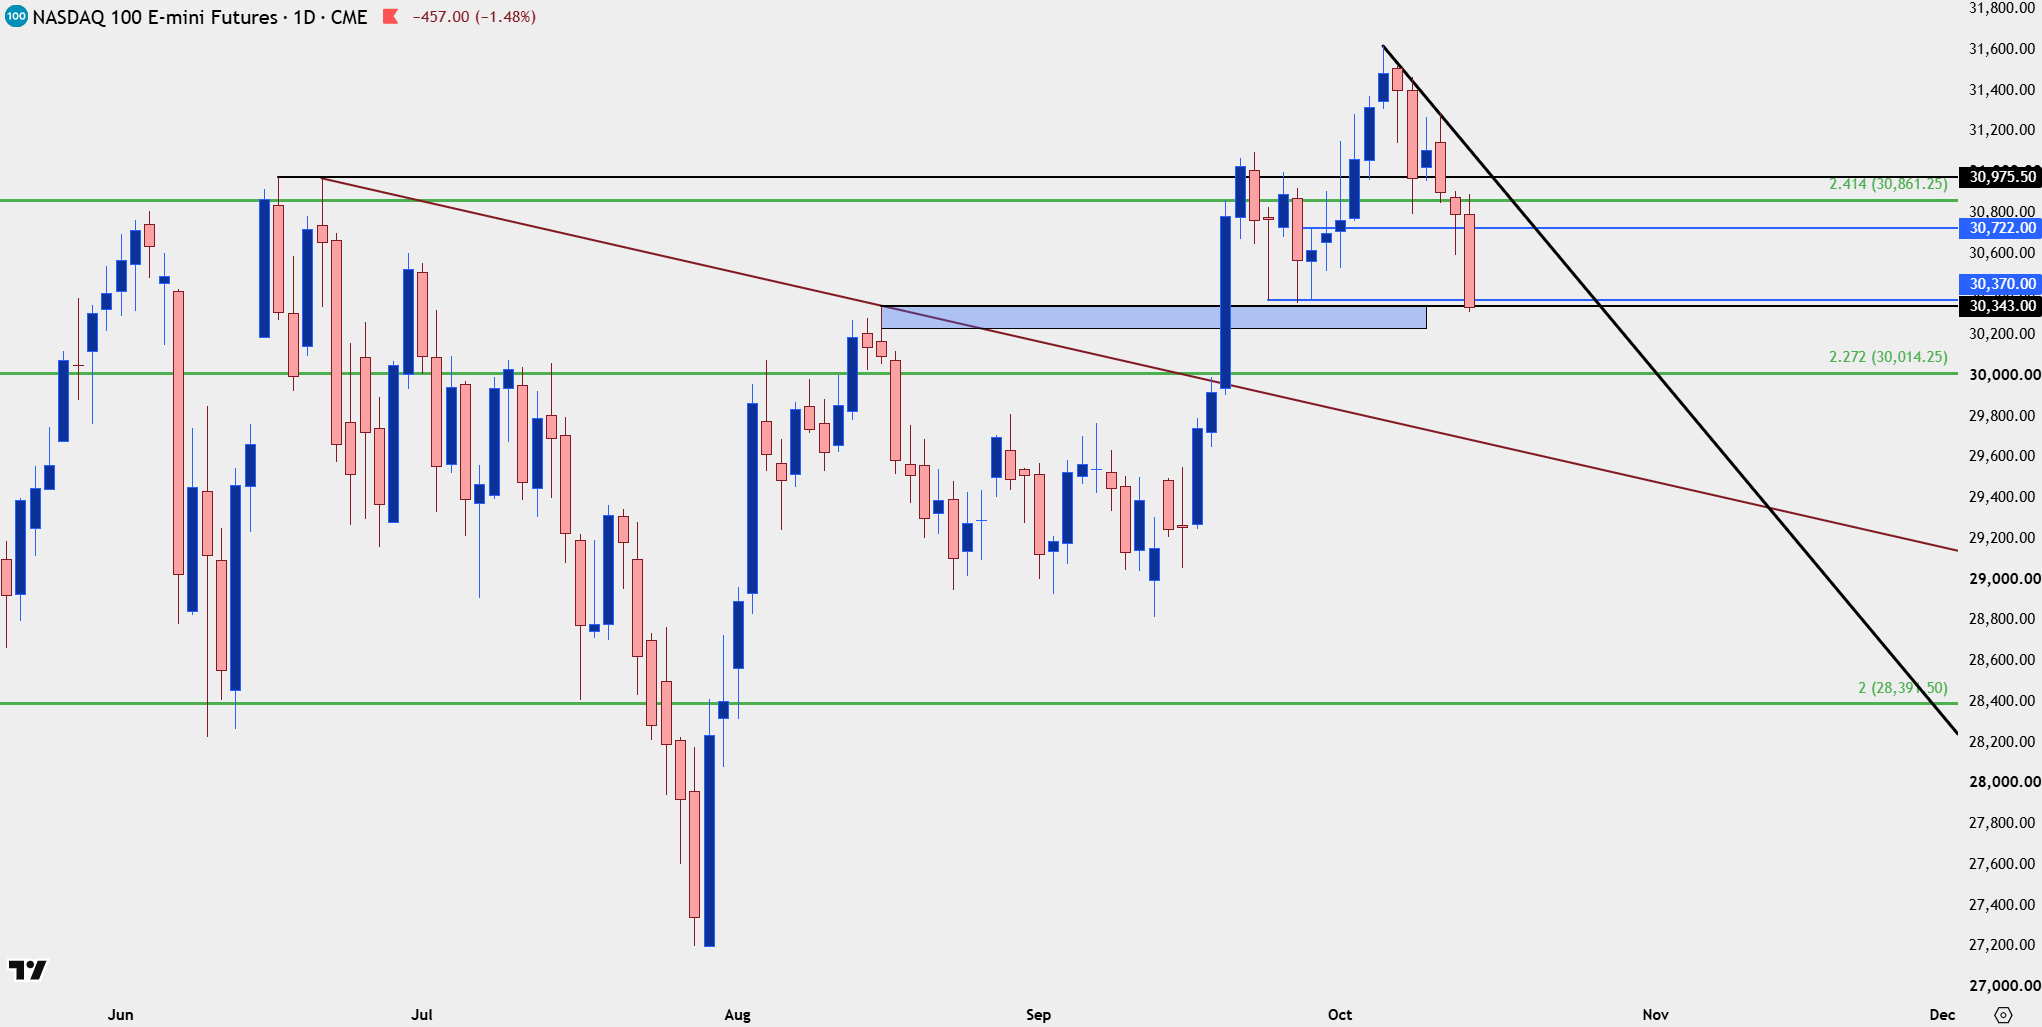
Chart prepared by James Stanley; data derived from Tradingview
When the Leaders Lag
The rally in NVDA has been massive from the 2022 lows, when it traded at a split adjusted $14 per share. And, obviously, many still holding long have some level of motivation to take profits, and this is why any rally will probably never be truly linear.
But when weakness shows even in a seemingly positive backdrop, something is amiss, and that may be a sign of things to come.
In late-September NVDIA announced an increase in their stock buyback, to total $235 Billion. This is more than a megacap of their own stock yet, at this point, price is lower than it was then.
This isn’t something that can be dialed back to performance, either, as the last quarterly report showed robust growth and the company is ostensibly doing well, with widespread support from the current administration.
Yet, the stock price has continued to go down…
Last week showed a bearish engulf on the weekly and that’s a formation often approached with aim of bearish continuation. That’s precisely what’s played so far this week and if the golden driver of the post-2022 recovery is getting hit, this could be sign that interest rates are taking their toll on the AI trade and, unless some relief is soon seen, this could develop into a much deeper sell-off type of scenario.
As for levels – the 210 spot is important, as this was the last swing low before the rally up to a fresh ATH, and it was also a key point of prior resistance. It’s also confluent with a bullish trendline and if a test at that price doesn’t bring buyers in – and – instead, brings more sellers, we could be looking at a much different macro scenario before too long.
NVDA Weekly Chart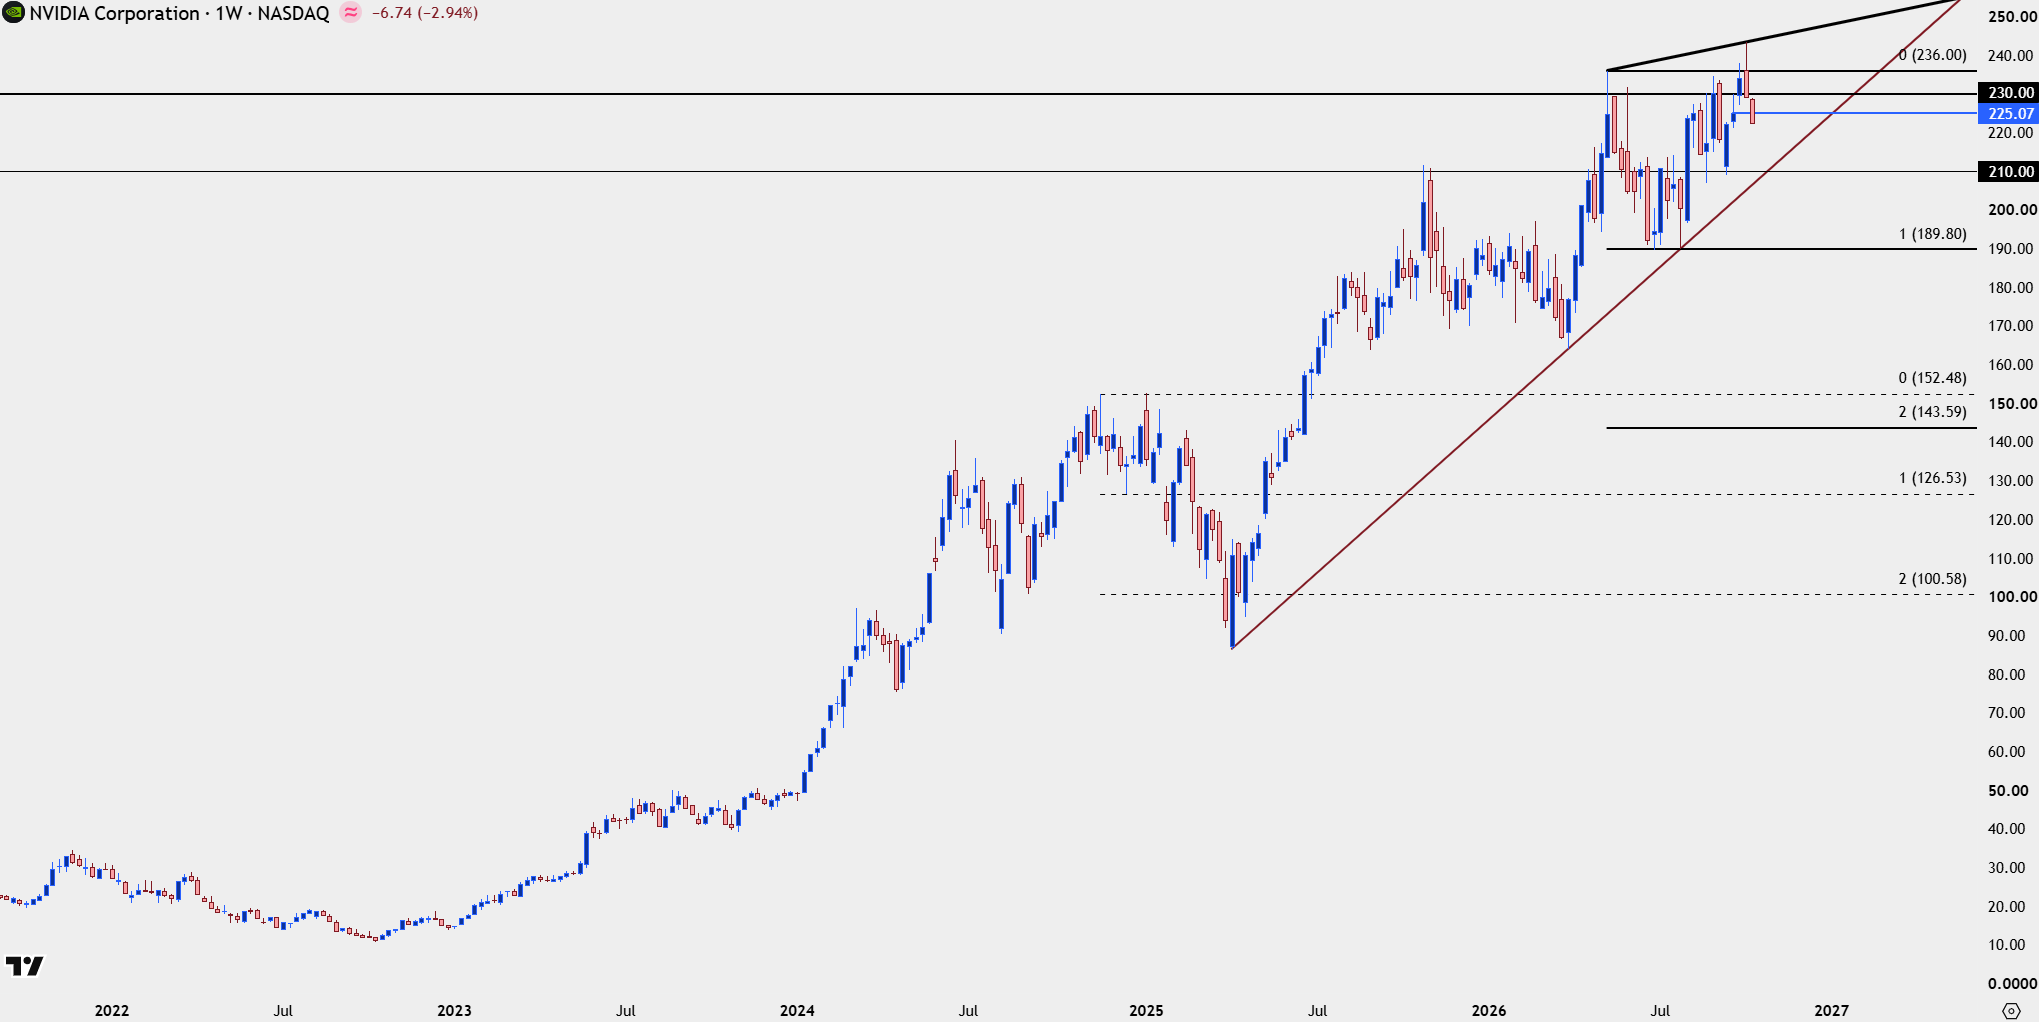
Chart prepared by James Stanley; data derived from Tradingview
--- written by James Stanley, Senior Market Analyst, Global Macro
Related tags:
Latest market news




Open an account in minutes
Experience award-winning platforms with fast and secure execution, and enjoy tight spreads from 0.5 pts on FX and 0.3 pts on indices.
Economic calendar
Web Trader platform
Our sophisticated web-based platform is packed with features.
Related articles
Stocks on Watch After CPI-Fueled Breakdown: SPX, Nasdaq, NVDA
Coming into the week there was an early case of divergence as AI and tech had started to show lag behind the S&P. That shift is growing more noticeable following a higher-than-expected CPI print.
Nasdaq 100 Forecast: NDX falls after hotter inflation data
U.S. stocks are falling after hotter-than-expected U.S. inflation data, which has lifted Fed rate hike expectations.


Pre-CPI USD Price Action Setups: EUR/USD, USD/JPY, GBP/USD, USD/CAD
Tomorrow brings an important inflation print as Treasury yields have started to stall and expectations for rate hikes have pared back. But another jolt to inflation could tilt those odds and impact price action across the USD complex.
This report is intended for general circulation only. It should not be construed as a recommendation, or an offer (or solicitation of an offer) to buy or sell any financial products. The information provided does not take into account your specific investment objectives, financial situation or particular needs. Before you act on any recommendation that may be contained in this report, independent advice ought to be sought from a financial adviser regarding the suitability of the investment product, taking into account your specific investment objectives, financial situation or particular needs.
StoneX Financial Pte. Ltd., may distribute reports produced by its respective foreign entities or affiliates within the StoneX group of companies or third parties pursuant to an arrangement under Regulation 32C of the Financial Advisers Regulations. Where the report is distributed to a person in Singapore who is not an accredited investor, expert investor or an institutional investor (as defined in the Securities Futures Act), StoneX Financial Pte. Ltd. accepts legal responsibility to such persons for the contents of the report only to the extent required by law. Singapore recipients should contact StoneX Financial Pte. Ltd. at 6826 9988 for matters arising from, or in connection with the report.
In the case of all other recipients of this report, to the extent permitted by applicable laws and regulations neither StoneX Financial Pte. Ltd. nor its associated companies will be responsible or liable for any loss or damage incurred arising out of, or in connection with, any use of the information contained in this report and all such liability is hereby expressly disclaimed. No representation or warranty is made, express or implied, that the content of this report is complete or accurate.
StoneX Financial Pte. Ltd. is not under any obligation to update this report.
Trading CFDs carries a high level of risk that may not be suitable for some investors. Consider your investment objectives, level of experience, financial resources, risk appetite and other relevant circumstances carefully. The possibility exists that you could lose some or all of your investments, including your initial deposits. If in doubt, please seek independent expert advice. Visit www.forex.com/en-sg/terms-and-policies for the complete Risk Disclosure Statement.