



ASX 200 Outlook: Jackson Hole Puts Monday Volatility in Focus
ASX 200 volatility tends to rise after Jackson Hole, while sector correlations highlight the clearest support, resistance and leadership signals.
Share this:

The ASX 200 heads into Jackson Hole with historical patterns pointing to higher volatility once the Australian market reopens on Monday. Sector correlations also highlight where leadership is strongest, while nearby support and resistance levels could shape the next directional move.
View related analysis:
- Jackson Hole FX Returns: Volatility Analysis for USD Dollar, FX Majors
- FX Futures Positioning: USD Falls, CAD Strengthens, JPY Shorts Return | COT Report
- US Dollar Bounce Looks Vulnerable, EUR/USD Respects Resistance for Now
- Australian Dollar Outlook: AUD/USD Faces Inflation, Fed and Jackson Hole
- Nasdaq 100 Outlook: Thanksgiving Seasonality and Volatility Trends
View related analysis:
- Jackson Hole FX Returns: Volatility Analysis for USD Dollar, FX Majors
- FX Futures Positioning: USD Falls, CAD Strengthens, JPY Shorts Return | COT Report
- US Dollar Bounce Looks Vulnerable, EUR/USD Respects Resistance for Now
- Australian Dollar Outlook: AUD/USD Faces Inflation, Fed and Jackson Hole
- Nasdaq 100 Outlook: Thanksgiving Seasonality and Volatility Trends
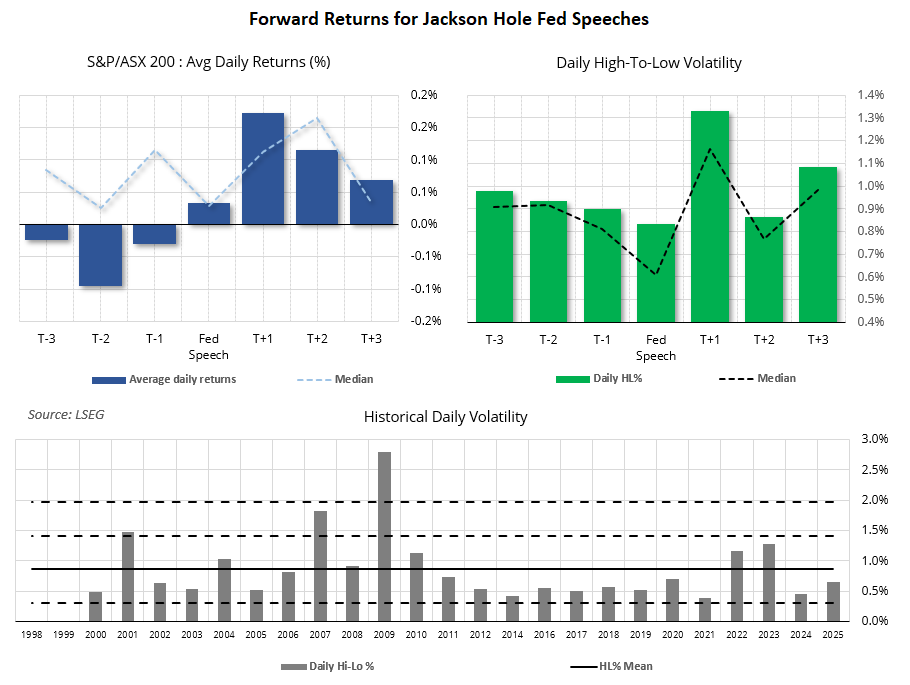
With the annual Jackson Hole symposium approaching, I wanted to look at how the ASX 200 has performed around the event. Given the highlight is the Fed Chair’s speech, we will look at ASX 200 performance over the three trading days either side of it, as well as on the day itself.
As the Fed Chair usually speaks on Friday lunchtime in Europe — around midnight in Australia — we can assume T-3 is Tuesday, T-2 is Wednesday and so on.
You can also see how FX majors have performed around the event in yesterday’s Jackson Hole preview. The main takeaway was that Friday tends to be the most volatile session for FX, although directional returns were not robust.
Source: ASX, LSEG
ASX 200 Returns Show Little Directional Edge
The ASX 200 has to wait until Monday to react to the Fed Chair’s speech, so the cash market tends to see its highest volatility on T+1. In contrast, the Friday cash session ahead of the speech is typically the least volatile.
T+1 also has the strongest average return at 0.17%, while the median return peaks at 0.16% on T+2. Neither is compelling enough for me to assume Monday is likely to deliver gains. The divergence between average and median returns also suggests the directional data is not particularly robust.
Source: ASX, LSEG
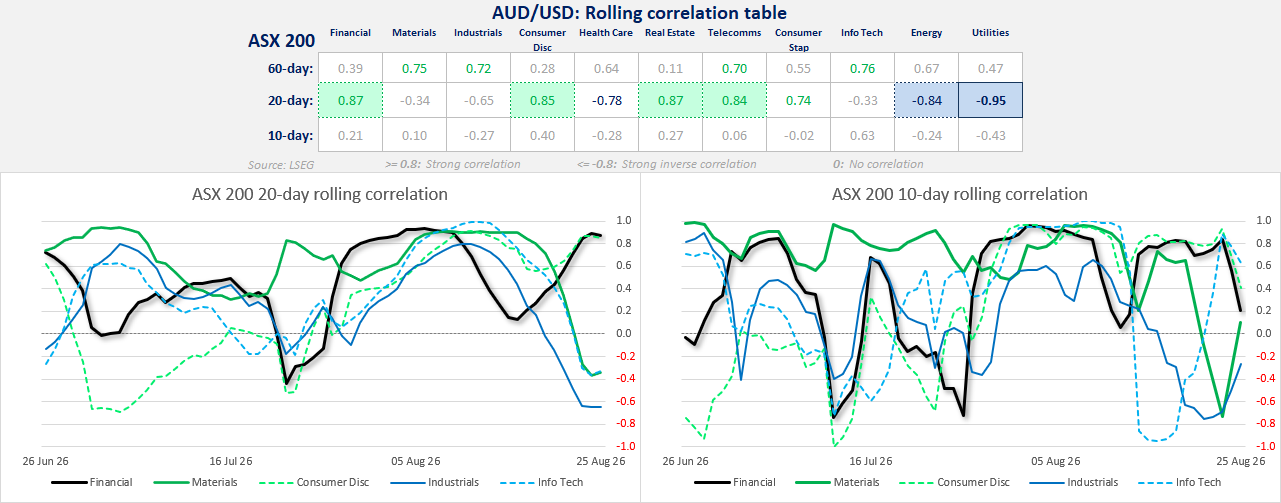
- 20-day correlations are the standout: Financials (+0.87), Consumer Discretionary (+0.85), Real Estate (+0.87) and Telecoms (+0.84) are moving closely with the ASX 200.
- Utilities (-0.95) and Energy (-0.84) show the strongest inverse relationships over 20 days, with Healthcare also notably negative (-0.78).
- 60-day leadership is broader: Materials (+0.75), Industrials (+0.72), Telecoms (+0.70) and Info Tech (+0.76) remain positively aligned with the index.
- 10-day correlations are weak overall, suggesting recent sector leadership is less reliable and more fragmented.
- Trader takeaway: Financials remain the cleanest short-term proxy for ASX 200 direction, while Utilities and Energy are behaving as relative hedges.
ASX 200 Cash Market: Options Level Analysis
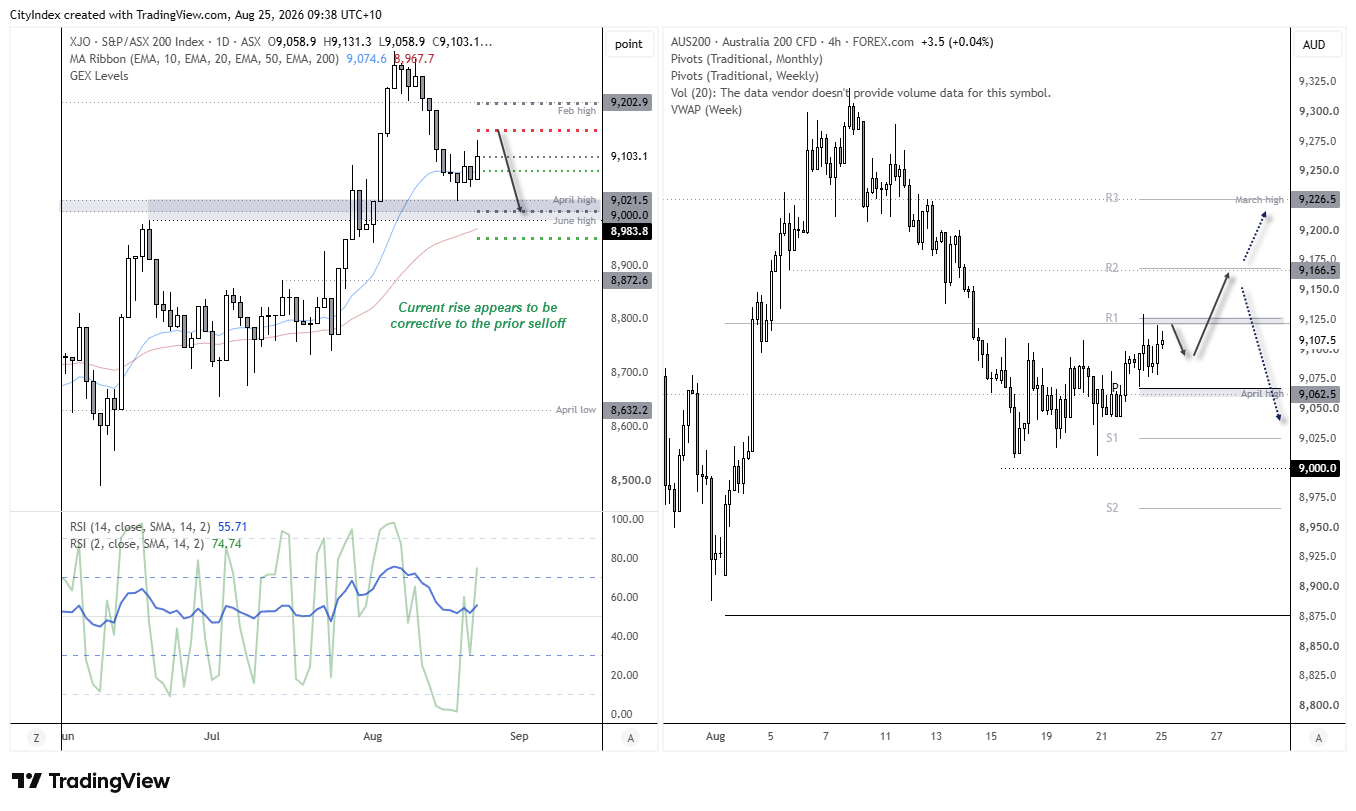
The ASX 200 is trading in a congested area around 9,100, which is likely to keep price action choppy until the index breaks decisively in either direction.
Source: ASX, LSEG
- On the upside, 9,150 is the main resistance level. A sustained break above it would improve the bullish outlook and put 9,200 in focus as the next likely target.
- On the downside, 9,075 is the first area of support, followed by the more important 9,000 level. A break below 9,000 would weaken the near-term outlook and increase the risk of a move towards 8,950, which stands out as the stronger support zone.\]
- For now, 9,100–9,150 is the key decision area. Holding above 9,100 keeps the bias mildly constructive, while rejection from 9,150 would favour another move back towards 9,075 and 9,000.
- Support: 9,075, 9,000, 8,950, Resistance: 9,150, 9,200
Latest market news




Open an account in minutes
Experience award-winning platforms with fast and secure execution, and enjoy tight spreads from 0.5 pts on FX and 0.3 pts on indices.
Economic calendar
Web Trader platform
Our sophisticated web-based platform is packed with features.
Related articles
USD/CHF Feels the Weight of US Midterms, USD/CAD Clings to Support
US midterms threaten fresh dollar volatility as USD/CHF tests technical support and USD/CAD clings to 1.3940 ahead of election results.
Gold forecast: XAU/USD stabilised after recent falls – for now
Gold has started the first week of the new month trying to recover some ground after another bruising week. Oil prices have taken a sharp drop and that has allowed risk assets to bounce back, which has clearly helped the precious metal too. However, with sentiment remaining bearish towards the metals, and with $4000 level having been taken out last week, the path of least resistance is to the downside for gold.


GBP/USD outlook: Currency Pair of the Week | November 2, 2026
The GBP/USD heads into a crowded week of event risk, with the midterm elections, a Bank of England rate decision and Friday's non-farm payrolls report all capable of moving markets sharply. The greenback remains fundamentally well supported by a hawkish Federal Reserve, but much of that is already priced in, while the renewed sell-off in technology stocks has exposed its vulnerability.
This report is intended for general circulation only. It should not be construed as a recommendation, or an offer (or solicitation of an offer) to buy or sell any financial products. The information provided does not take into account your specific investment objectives, financial situation or particular needs. Before you act on any recommendation that may be contained in this report, independent advice ought to be sought from a financial adviser regarding the suitability of the investment product, taking into account your specific investment objectives, financial situation or particular needs.
StoneX Financial Pte. Ltd., may distribute reports produced by its respective foreign entities or affiliates within the StoneX group of companies or third parties pursuant to an arrangement under Regulation 32C of the Financial Advisers Regulations. Where the report is distributed to a person in Singapore who is not an accredited investor, expert investor or an institutional investor (as defined in the Securities Futures Act), StoneX Financial Pte. Ltd. accepts legal responsibility to such persons for the contents of the report only to the extent required by law. Singapore recipients should contact StoneX Financial Pte. Ltd. at 6826 9988 for matters arising from, or in connection with the report.
In the case of all other recipients of this report, to the extent permitted by applicable laws and regulations neither StoneX Financial Pte. Ltd. nor its associated companies will be responsible or liable for any loss or damage incurred arising out of, or in connection with, any use of the information contained in this report and all such liability is hereby expressly disclaimed. No representation or warranty is made, express or implied, that the content of this report is complete or accurate.
StoneX Financial Pte. Ltd. is not under any obligation to update this report.
Trading CFDs carries a high level of risk that may not be suitable for some investors. Consider your investment objectives, level of experience, financial resources, risk appetite and other relevant circumstances carefully. The possibility exists that you could lose some or all of your investments, including your initial deposits. If in doubt, please seek independent expert advice. Visit www.forex.com/en-sg/terms-and-policies for the complete Risk Disclosure Statement.