


USD Sets Fresh Yearly High as EUR/USD Drops Dramatically, USD/JPY Stable
Well, it was a week of USD strength that wasn’t entirely pushed by USD/JPY, as a strong sell-off in EUR/USD has pushed the major pair to its most oversold state in a decade.
Share this:

USD Talking Points:
- It was another bullish week for the USD which extends the streak to three weeks as the currency set a fresh yearly high.
- While USD/JPY was a major push point for USD strength over the past few years last week it was a dramatic fall in EUR/USD that pushed the pair to its most oversold state in more than a decade.
USD strength ran rampant again this week as the Dollar burst through a number of resistance levels, including the key Fibonacci level of 101.80 which had previously held the highs in June of this year. And, interestingly, while it was the carry trade in USD/JPY that was a large source of USD strength leading into Q3, last week saw the USD/JPY pair in somewhat of a calm manner. And, instead, it was the larger component of the DXY basket of the Euro that provided a significant portion of that push.
From the weekly USD chart, we can see the currency breaking out and testing levels that haven’t traded since April of 2025, when the DXY basket was in the midst of a drastic drop. For much of the almost 18 months since, the Dollar has been in a range and that’s what makes this week’s move so important, as an indication of range break opens the door for trends, especially considering the move that we’ve seen in both rates and expectations around the FOMC.
But, with that said, chasing the move at this point, particularly in a pair like EUR/USD, can prove problematic, as I’ll look at below.
US Dollar Weekly Chart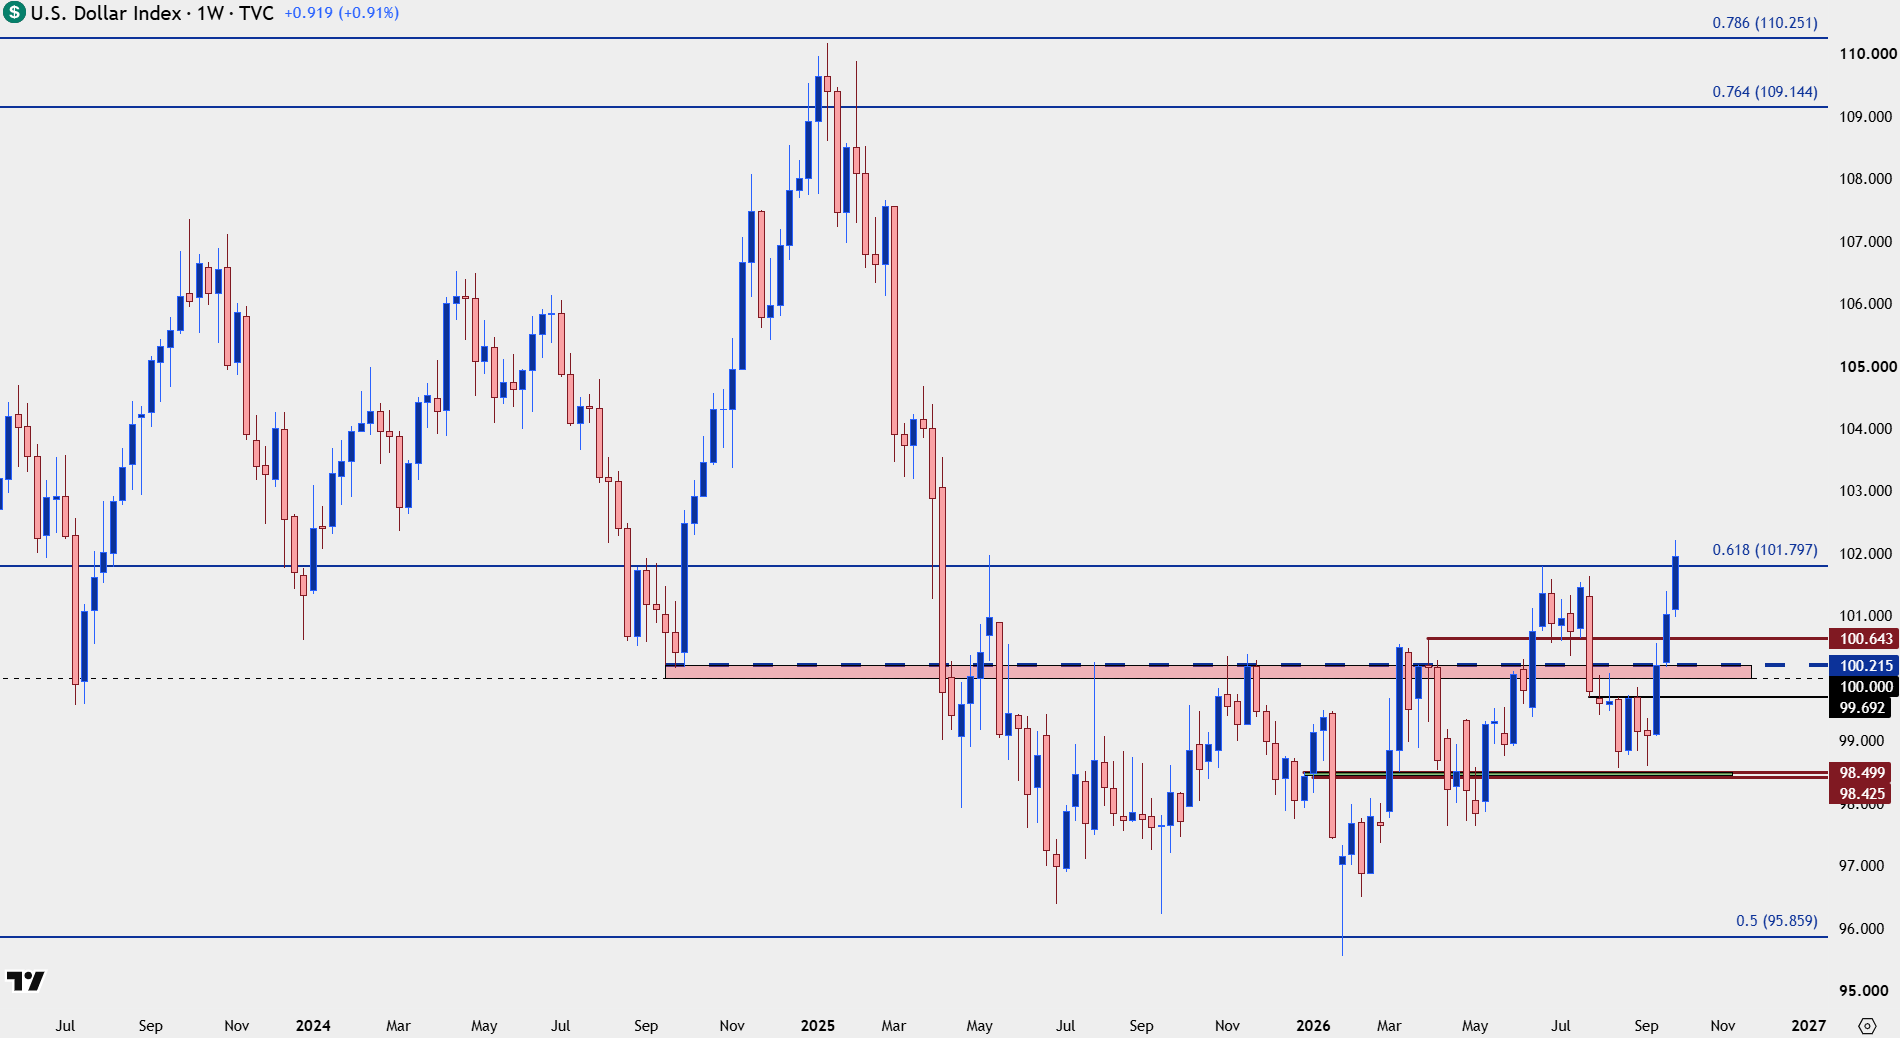
Chart prepared by James Stanley; data derived from Tradingview
EUR/USD
This has been the big item of recent change, as EUR/USD had previously exhibited quite a bit of mean reverting, range-bound tendency. Recently, the pair has pushed into oversold territory on the daily chart and that still hasn’t change – and as a matter of fact, this week saw the pair go to its most oversold state since 2015, around the time that a significant low set in the pair.
From the monthly chart a big level has come into the picture as the 61.8% retracement of the lifetime move in the pair, plotted at 1.1212, is just three pips below the weekly low. There’s quite a bit of history at that spot, as that level marked range resistance back in 2015 through 2017, and then it came in again to hold highs in 2023 and 2024. Now, it’s back in as support.
EUR/USD Monthly Price Chart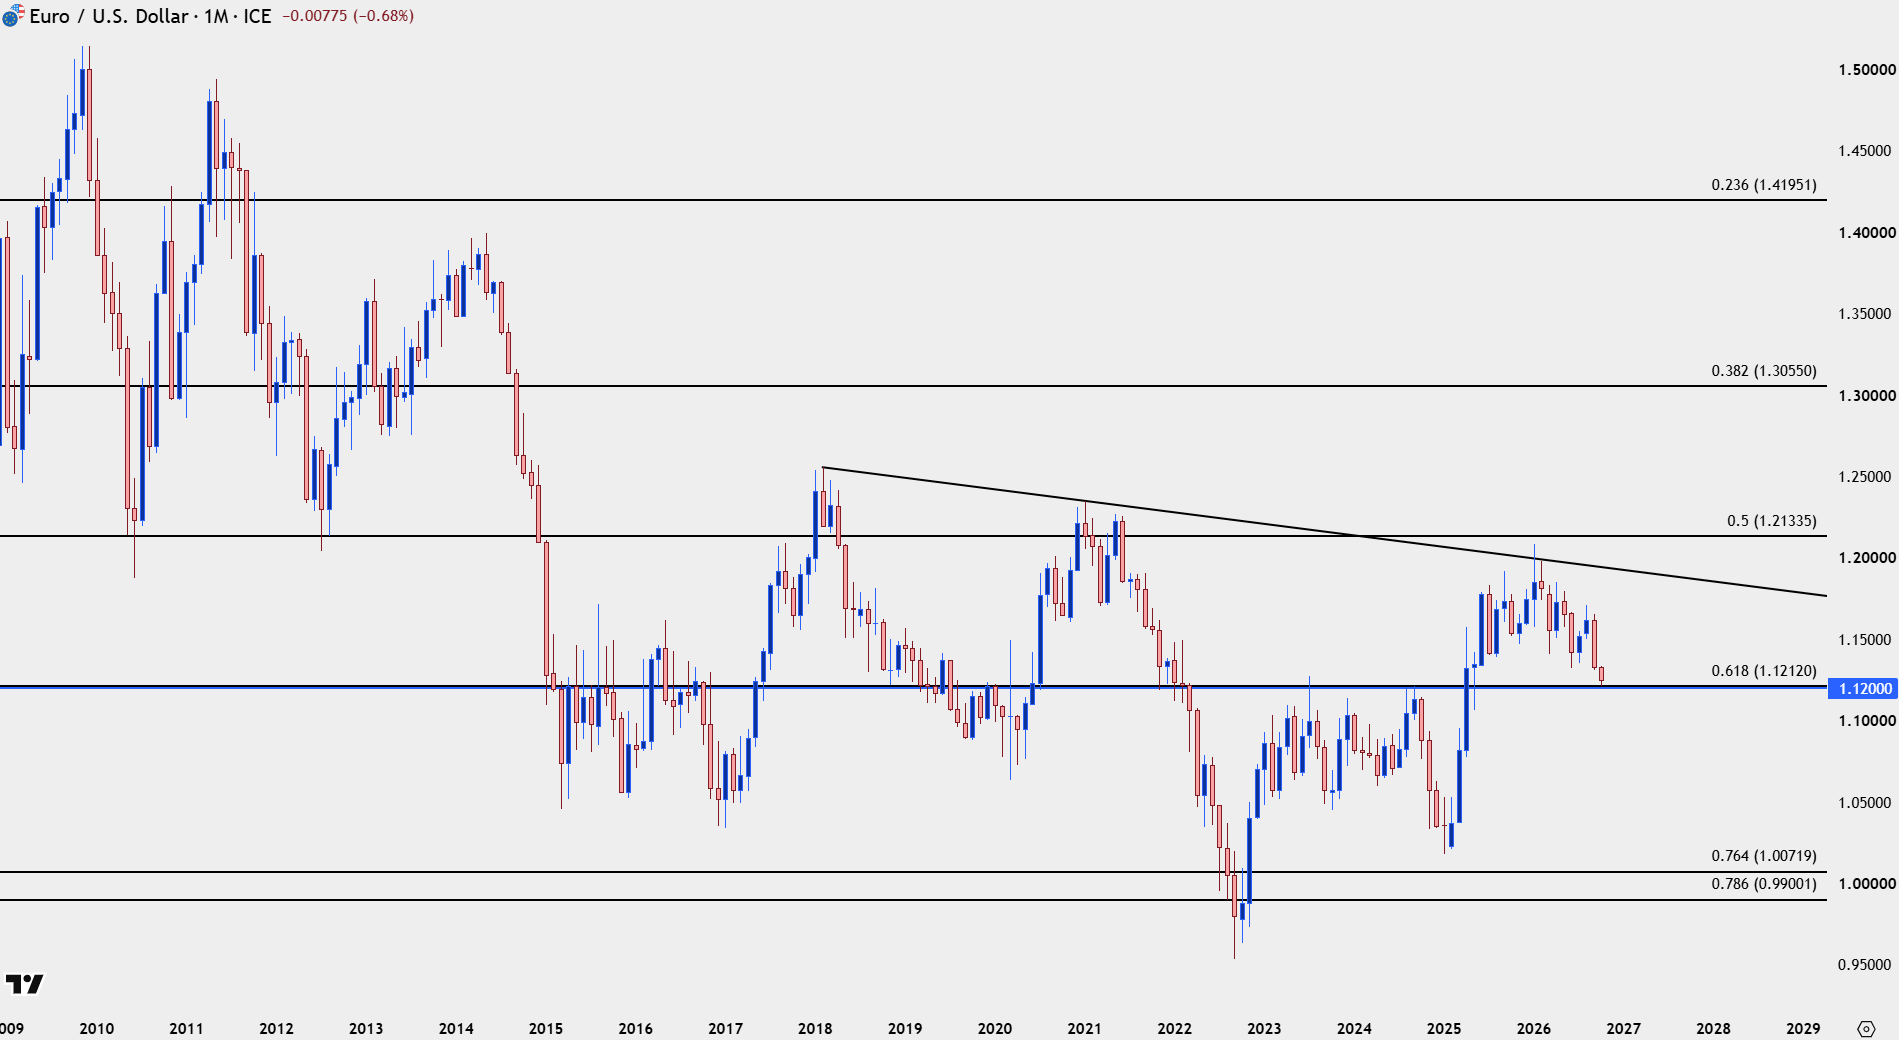
Chart prepared by James Stanley; data derived from Tradingview
EUR/USD Shorter-Term
As of this writing, daily RSI is at 20.28 in EUR/USD, which is subject to change into the weekly close. But yesterday’s close saw the indicator at 18.19, and that’s the lowest reading since March of 2015, which is around the time of a significant low around the 1.0500 handle. And it’s just after that when we saw the two-year range build with that 1.1212 level acting as a line in the sand.
This doesn’t mean price has to go up – and I wanted to highlight the prior instance of such as evidence as the reading in July of 2014 simply saw the sell-off extend even deeper. The point of the indicator is to highlight extremes, such as we’re seeing, and this sets up for either one of two scenarios.
If we do see that extreme reading stretch even further, we would see USD strength that would probably be illustrating some type of major macro stress. Or, alternatively, if we see the market step back from the proverbial ledge, there could be mean reversion setups to work with.
EUR/USD Daily Chart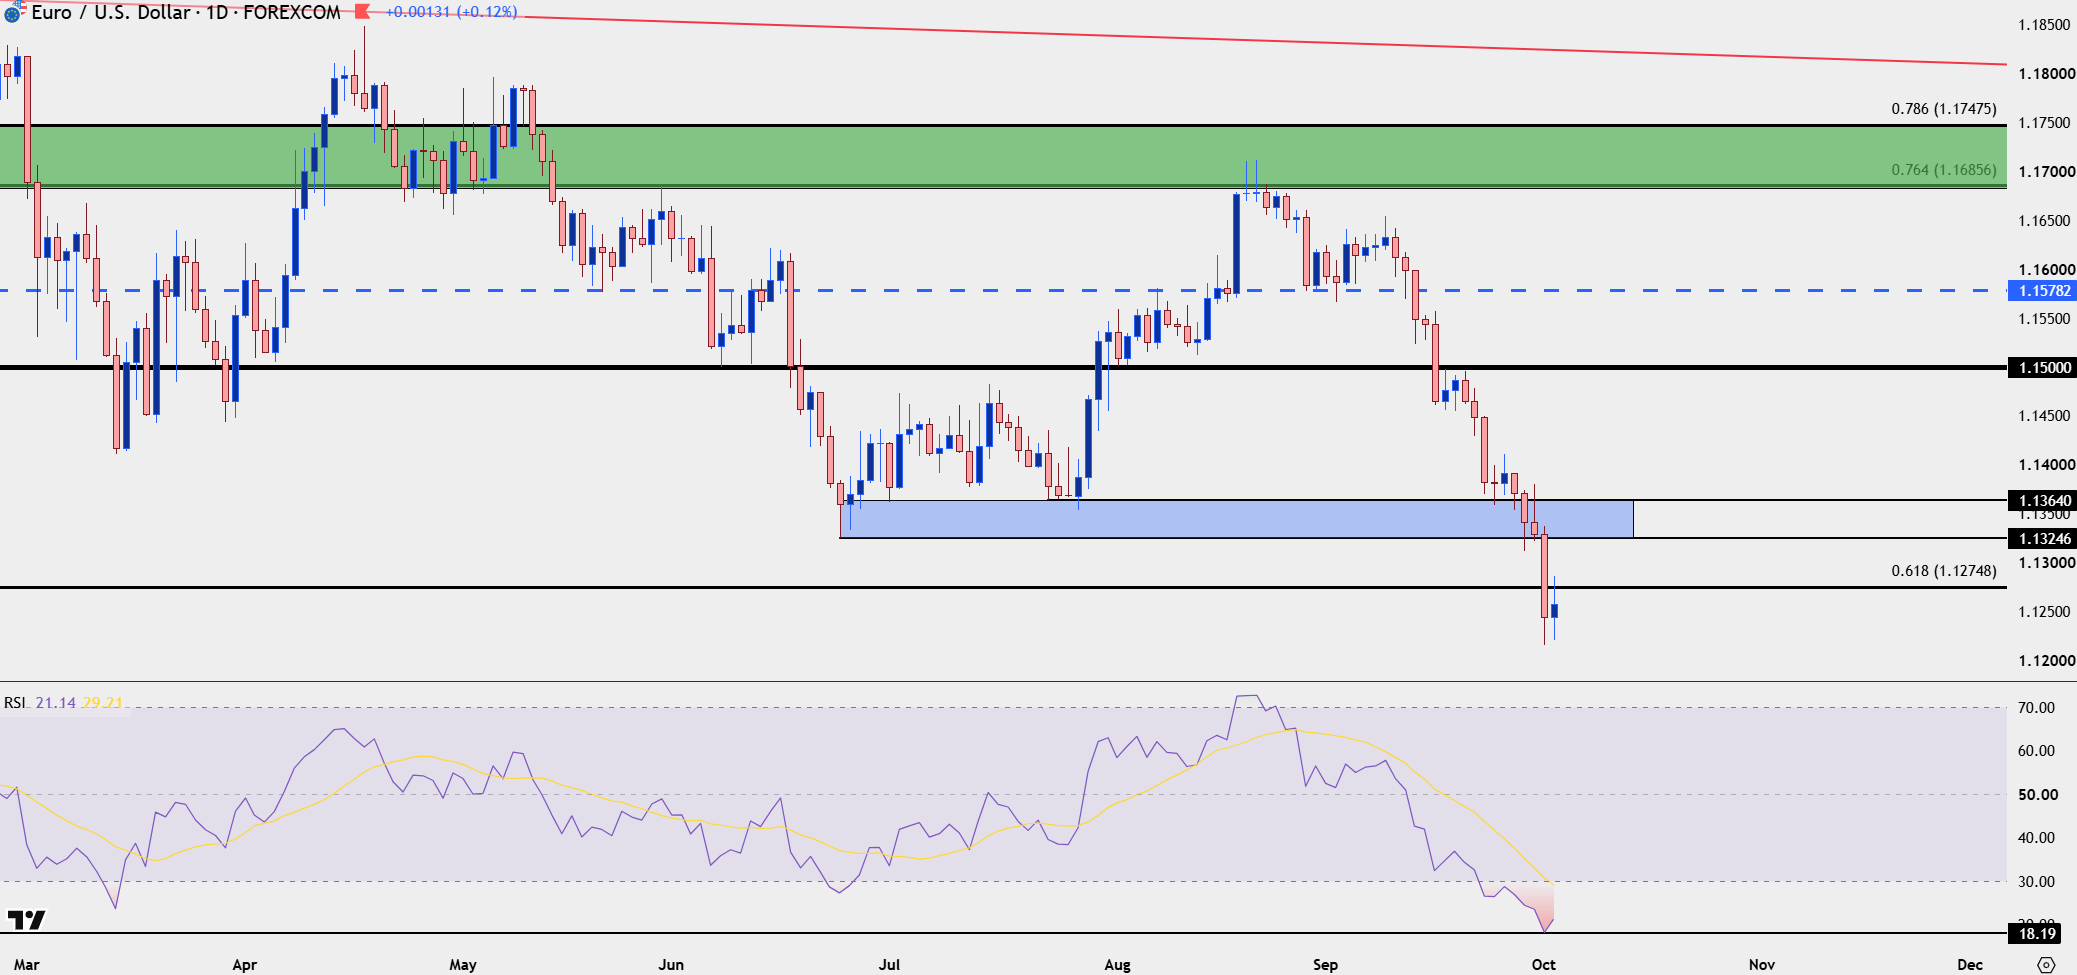
Chart prepared by James Stanley; data derived from Tradingview
USD/JPY
All factors considered, USD/JPY was fairly calm this week. Previously the pair was very much a push point for USD-strength and the still crowded carry trade retains a large bearing over whether a USD reversal can show. But, at this stage, shorter-term structure remains bullish and we saw yet another example of that this week, as pullbacks to 156.68 and 157.22 were bid by buyers.
The underside wicks on the daily chart illustrate this theme well, and it keeps bulls in the drivers seat as we go into next week.
Perhaps the more pertinent question is where the line-in-the-sand is for resistance, as we’ve seen trepidation from buyers on a 160 re-test as the prior high of 159.00 came in a week prior. And, for this week, resistance held around 158.00, so we can already see a build of fear from bulls on rallies and that’s something that could potentially play through for a reversal, if we do finally see buyers abandoning support on pullbacks.
There’s no evidence of that yet – but that’s what should be on the radar for next week. Until then, support is bullish (until it’s not).
USD/JPY Daily Price Chart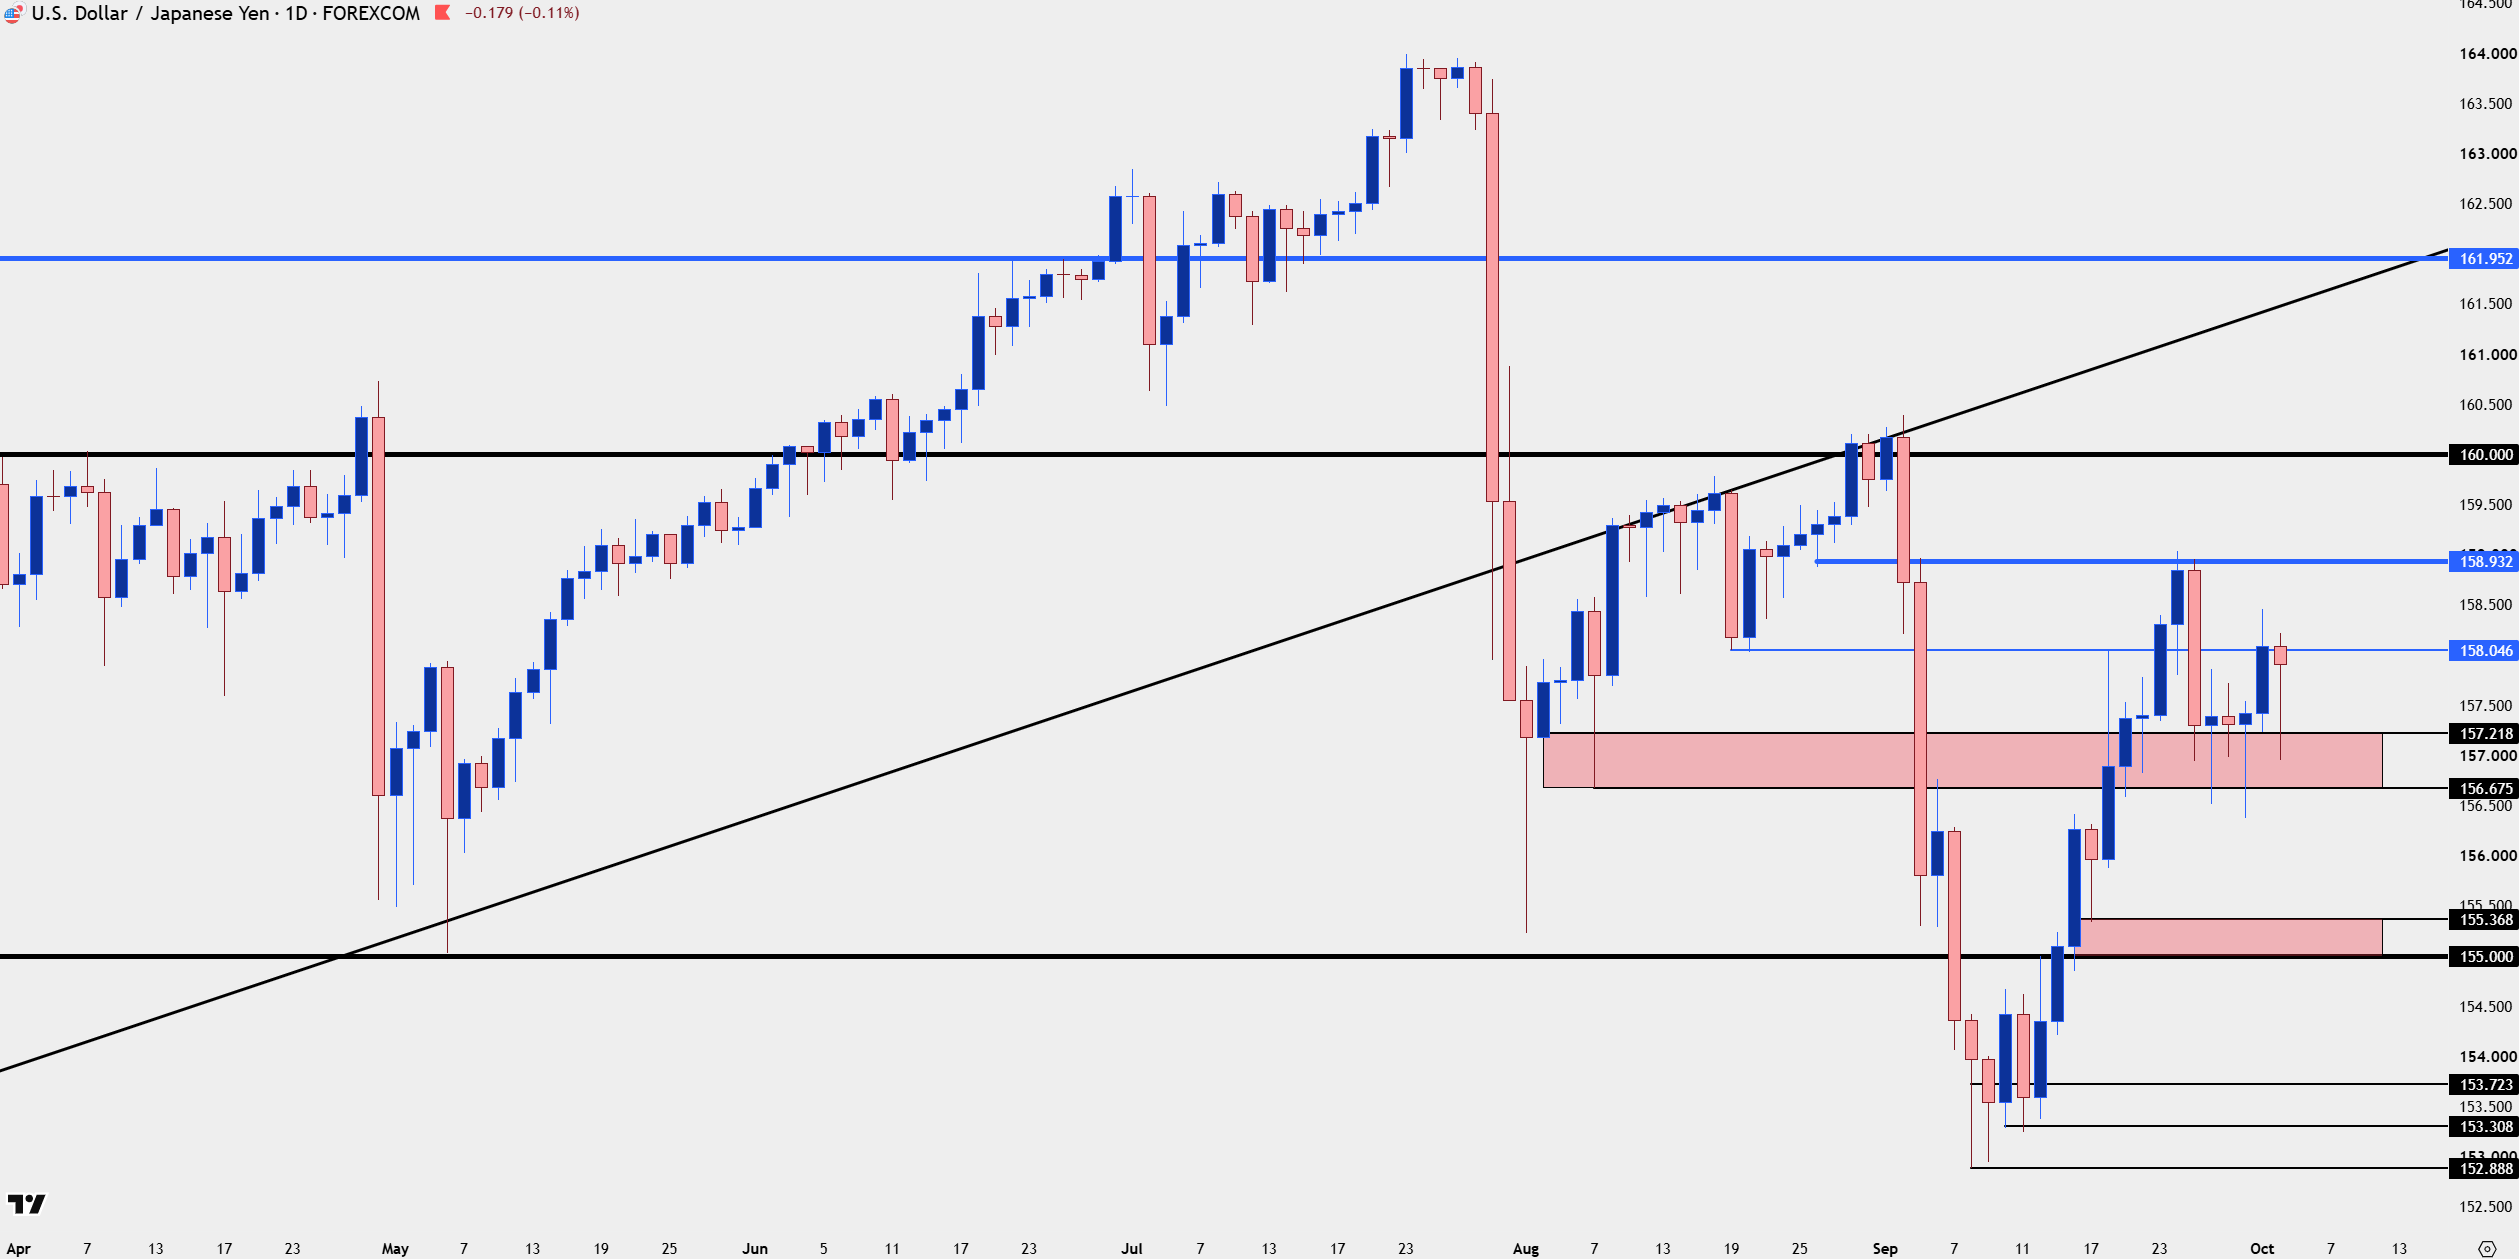
Chart prepared by James Stanley; data derived from Tradingview
--- written by James Stanley, Senior Market Analyst, Global Macro
Latest market news


Open an account in minutes
Experience award-winning platforms with fast and secure execution, and enjoy tight spreads from 0.5 pts on FX and 0.3 pts on indices.
Economic calendar
Web Trader platform
Our sophisticated web-based platform is packed with features.
Related articles
USD Sets Fresh Yearly High as EUR/USD Drops Dramatically, USD/JPY Stable
Well, it was a week of USD strength that wasn’t entirely pushed by USD/JPY, as a strong sell-off in EUR/USD has pushed the major pair to its most oversold state in a decade.
USD Sets Fresh Yearly High as EUR/USD Drops Dramatically, USD/JPY Stable
Well, it was a week of USD strength that wasn’t entirely pushed by USD/JPY, as a strong sell-off in EUR/USD has pushed the major pair to its most oversold state in a decade.
Dow Jones Forecast: DJIA rises after weaker jobs data
U.S. stocks are rising after weaker-than-expected U.S. jobs data saw markets rein in rate hike expectations.

This report is intended for general circulation only. It should not be construed as a recommendation, or an offer (or solicitation of an offer) to buy or sell any financial products. The information provided does not take into account your specific investment objectives, financial situation or particular needs. Before you act on any recommendation that may be contained in this report, independent advice ought to be sought from a financial adviser regarding the suitability of the investment product, taking into account your specific investment objectives, financial situation or particular needs.
StoneX Financial Pte. Ltd., may distribute reports produced by its respective foreign entities or affiliates within the StoneX group of companies or third parties pursuant to an arrangement under Regulation 32C of the Financial Advisers Regulations. Where the report is distributed to a person in Singapore who is not an accredited investor, expert investor or an institutional investor (as defined in the Securities Futures Act), StoneX Financial Pte. Ltd. accepts legal responsibility to such persons for the contents of the report only to the extent required by law. Singapore recipients should contact StoneX Financial Pte. Ltd. at 6826 9988 for matters arising from, or in connection with the report.
In the case of all other recipients of this report, to the extent permitted by applicable laws and regulations neither StoneX Financial Pte. Ltd. nor its associated companies will be responsible or liable for any loss or damage incurred arising out of, or in connection with, any use of the information contained in this report and all such liability is hereby expressly disclaimed. No representation or warranty is made, express or implied, that the content of this report is complete or accurate.
StoneX Financial Pte. Ltd. is not under any obligation to update this report.
Trading CFDs carries a high level of risk that may not be suitable for some investors. Consider your investment objectives, level of experience, financial resources, risk appetite and other relevant circumstances carefully. The possibility exists that you could lose some or all of your investments, including your initial deposits. If in doubt, please seek independent expert advice. Visit www.forex.com/en-sg/terms-and-policies for the complete Risk Disclosure Statement.