







SP500 Long Buybacks And Value
Whilst the S&P500 bullish trend rages on, there are near-term signs of exhaustion. Yet looking at the leaders and the laggards, it also appears that the driving forces behind these new highs has changed.
Share this:

Whilst the S&P500 bullish trend rages on, there are near-term signs of exhaustion. Yet looking at the leaders and the laggards, it also appears that the driving forces behind these new highs has changed.
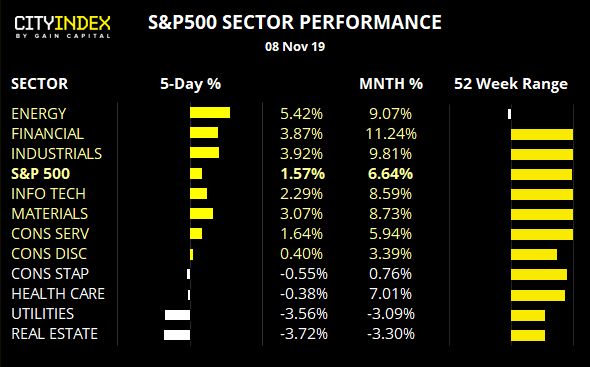
It’s been a good week for energy stocks, with trade optimism and higher oil prices obviously helping. If the deal can go through and commodity prices rise, energy stocks appear quite attractive at their relatively cheap lows. And this shift in trade sentiment has also seen top performers of late reverse course, as real estate, utilities and healthcare have dipped. So, trade talks remain a clear driver of sentiment, and e can’t help but wonder if the December “phase one” signing has actually been aligned with good old Santa’s rally. Time will tell no doubt tell.
S&P500: The trend is undeniably strong and the break to new highs reaffirms the bullish channel from the June low. And we can also see that buybacks remain a key driver for the S&P500 as the buyback index ETF (lower panel) has broken to new highs in tandem with the S&P’s breakout.
That said, a series of indecision candles above the upper keltner band warns of potential trend exhaustion over the near-term which leaves the potential for a pause in trend or correction. And these candles have formed just beneath the monthly R1 pivot. It’s also worth noting that a bearish pinbar formed, despite the positive news that the US will roll back tariffs as part of a deal.
- Bulls could look for prices to consolidate/retrace towards 3065.9 before seeking new longs.
- If prices break below 3065.9 then a deeper correction is on the cards, although bulls could be eager to buy any dips above 3028 support given the significance of the level.
- If bearish momentum takes prices notably lower, then bulls would be prudent to step aside until the dust settles. Moreover, if we see the yen and gold catch a bid again, then perhaps something larger is going down (whether economically, or yet another reversal of sentient with trade talks).
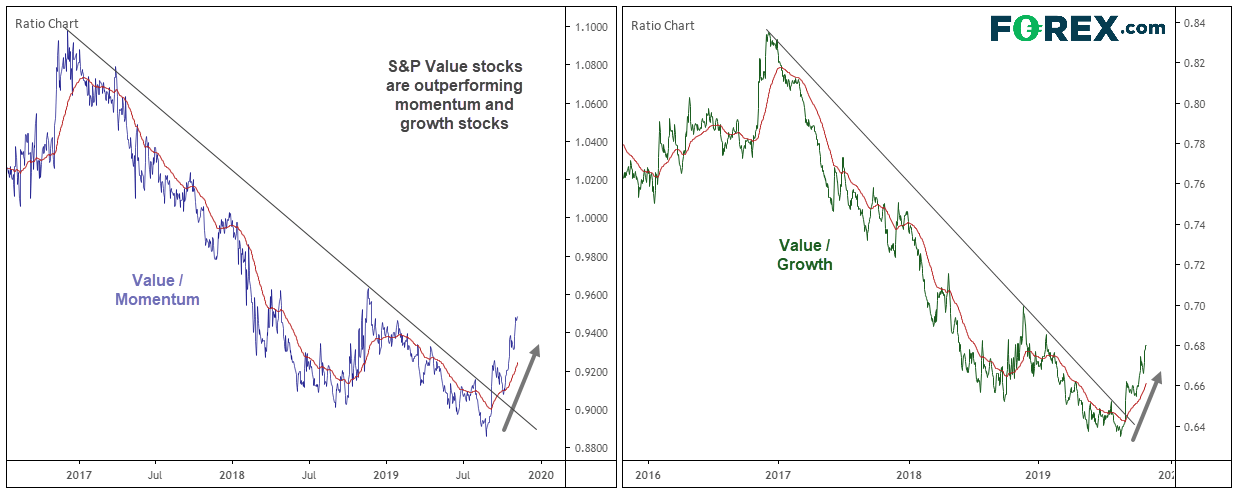
To finish up on a different angle, I can’t help but notice that value stocks are coming back into fashion whilst the S&P500 breaks to new highs. Value stocks are considered below fundamental value (therefore ‘cheap’ by some metrics) and have mostly underperformed the S&P500 since the 2009 low. Moreover, value stocks are outperforming both momentum and growth stocks. This could be quite telling regarding the relative value of the S&P500, as growth stocks revenues are expected to outperform relative to the average company (therefor higher prices) and momentum stocks are those which generally lead the index higher. So if momentum stocks are lagging and growth stocks are now not expected to grow relative to the average, what does this say about the underlying health of this bull market? Whilst this could take some time to play out, the dynamic has certainly changed and is worth keeping track of as this bull market develops.
Whilst the S&P500 bullish trend rages on, there are near-term signs of exhaustion. Yet looking at the leaders and the laggards, it also appears that the driving forces behind these new highs has changed.
It’s been a good week for energy stocks, with trade optimism and higher oil prices obviously helping. If the deal can go through and commodity prices rise, energy stocks appear quite attractive at their relatively cheap lows. And this shift in trade sentiment has also seen top performers of late reverse course, as real estate, utilities and healthcare have dipped. So, trade talks remain a clear driver of sentiment, and e can’t help but wonder if the December “phase one” signing has actually been aligned with good old Santa’s rally. Time will tell no doubt tell.
S&P500: The trend is undeniably strong and the break to new highs reaffirms the bullish channel from the June low. And we can also see that buybacks remain a key driver for the S&P500 as the buyback index ETF (lower panel) has broken to new highs in tandem with the S&P’s breakout.
That said, a series of indecision candles above the upper keltner band warns of potential trend exhaustion over the near-term which leaves the potential for a pause in trend or correction. And these candles have formed just beneath the monthly R1 pivot. It’s also worth noting that a bearish pinbar formed, despite the positive news that the US will roll back tariffs as part of a deal.
- Bulls could look for prices to consolidate/retrace towards 3065.9 before seeking new longs.
- If prices break below 3065.9 then a deeper correction is on the cards, although bulls could be eager to buy any dips above 3028 support given the significance of the level.
- If bearish momentum takes prices notably lower, then bulls would be prudent to step aside until the dust settles. Moreover, if we see the yen and gold catch a bid again, then perhaps something larger is going down (whether economically, or yet another reversal of sentient with trade talks).
To finish up on a different angle, I can’t help but notice that value stocks are coming back into fashion whilst the S&P500 breaks to new highs. Value stocks are considered below fundamental value (therefore ‘cheap’ by some metrics) and have mostly underperformed the S&P500 since the 2009 low. Moreover, value stocks are outperforming both momentum and growth stocks. This could be quite telling regarding the relative value of the S&P500, as growth stocks revenues are expected to outperform relative to the average company (therefor higher prices) and momentum stocks are those which generally lead the index higher. So if momentum stocks are lagging and growth stocks are now not expected to grow relative to the average, what does this say about the underlying health of this bull market? Whilst this could take some time to play out, the dynamic has certainly changed and is worth keeping track of as this bull market develops.
Related analysis:
S&P500: The Long & Short Of It | SPX, SYS, ORLY, EBAY, TXN
Trade Deal Optimism From China Triggers Euphoric Mood - An Update On SPX, NDX & Hang Seng
Related tags:
Latest market news




Open an account in minutes
Experience award-winning platforms with fast and secure execution, and enjoy tight spreads from 0.5 pts on FX and 0.3 pts on indices.
Economic calendar
Web Trader platform
Our sophisticated web-based platform is packed with features.
Related articles

RBA delivers 25bp hike, Bullock now the main event
The RBA delivered the expected 25bp hike, but Bullock’s press conference now looms as the bigger volatility risk for AUD/USD and the ASX 200.


S&P 500 forecast: Stocks extend drop as correction risks grow
US and global equity markets have extended Wednesday’s sell-off, with Wall Street opening lower after a weak handover from Asia and Europe. The deterioration in risk appetite has been spreading across global markets. The dollar was firmer, Treasury yields were holding onto yesterday’s gains, while gold, silver and bitcoin were all under pressure alongside equities and major currencies.


ASX 200 Rebound Stalls Despite Wall Street Surge
The ASX 200 rebound is struggling for traction despite a powerful Wall Street rally, leaving 8800 resistance and downside risks in focus.

This report is intended for general circulation only. It should not be construed as a recommendation, or an offer (or solicitation of an offer) to buy or sell any financial products. The information provided does not take into account your specific investment objectives, financial situation or particular needs. Before you act on any recommendation that may be contained in this report, independent advice ought to be sought from a financial adviser regarding the suitability of the investment product, taking into account your specific investment objectives, financial situation or particular needs.
StoneX Financial Pte. Ltd., may distribute reports produced by its respective foreign entities or affiliates within the StoneX group of companies or third parties pursuant to an arrangement under Regulation 32C of the Financial Advisers Regulations. Where the report is distributed to a person in Singapore who is not an accredited investor, expert investor or an institutional investor (as defined in the Securities Futures Act), StoneX Financial Pte. Ltd. accepts legal responsibility to such persons for the contents of the report only to the extent required by law. Singapore recipients should contact StoneX Financial Pte. Ltd. at 6826 9988 for matters arising from, or in connection with the report.
In the case of all other recipients of this report, to the extent permitted by applicable laws and regulations neither StoneX Financial Pte. Ltd. nor its associated companies will be responsible or liable for any loss or damage incurred arising out of, or in connection with, any use of the information contained in this report and all such liability is hereby expressly disclaimed. No representation or warranty is made, express or implied, that the content of this report is complete or accurate.
StoneX Financial Pte. Ltd. is not under any obligation to update this report.
Trading CFDs carries a high level of risk that may not be suitable for some investors. Consider your investment objectives, level of experience, financial resources, risk appetite and other relevant circumstances carefully. The possibility exists that you could lose some or all of your investments, including your initial deposits. If in doubt, please seek independent expert advice. Visit www.forex.com/en-sg/terms-and-policies for the complete Risk Disclosure Statement.