




Stocks Doing what They Do Best Heading Higher
Not only is 2942 an important horizontal level, but it is also near the 61.8% Fibonacci level
Share this:

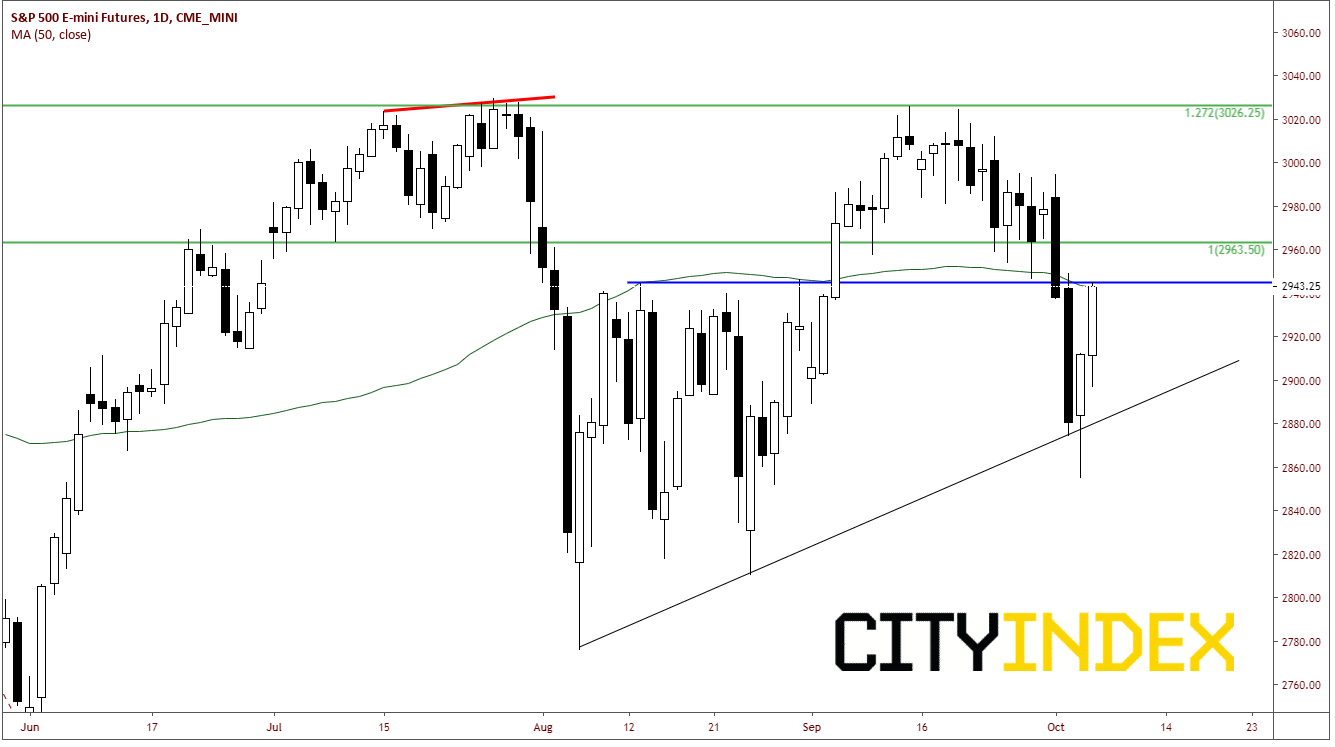
After days of disappointing data, S&P 500 Futures (S&Ps) were down nearly 4.5% over the last few days. However, after the benign Nonfarm payrolls were released today, S&Ps continued the rally which began yesterday afternoon, while most of the USD currency pairs remained in tight ranges. Stocks fell yesterday and tested the rising trendline, which dates back to August 6th yesterday, and failed to break though it. Once they failed to move lower below the trendline, price reversed and bounced back to the all-important 2942, which has been a pivotal point for stocks since early in August. It is also the 50 Day Moving Average.
Source: Tradingview, City Index, CME
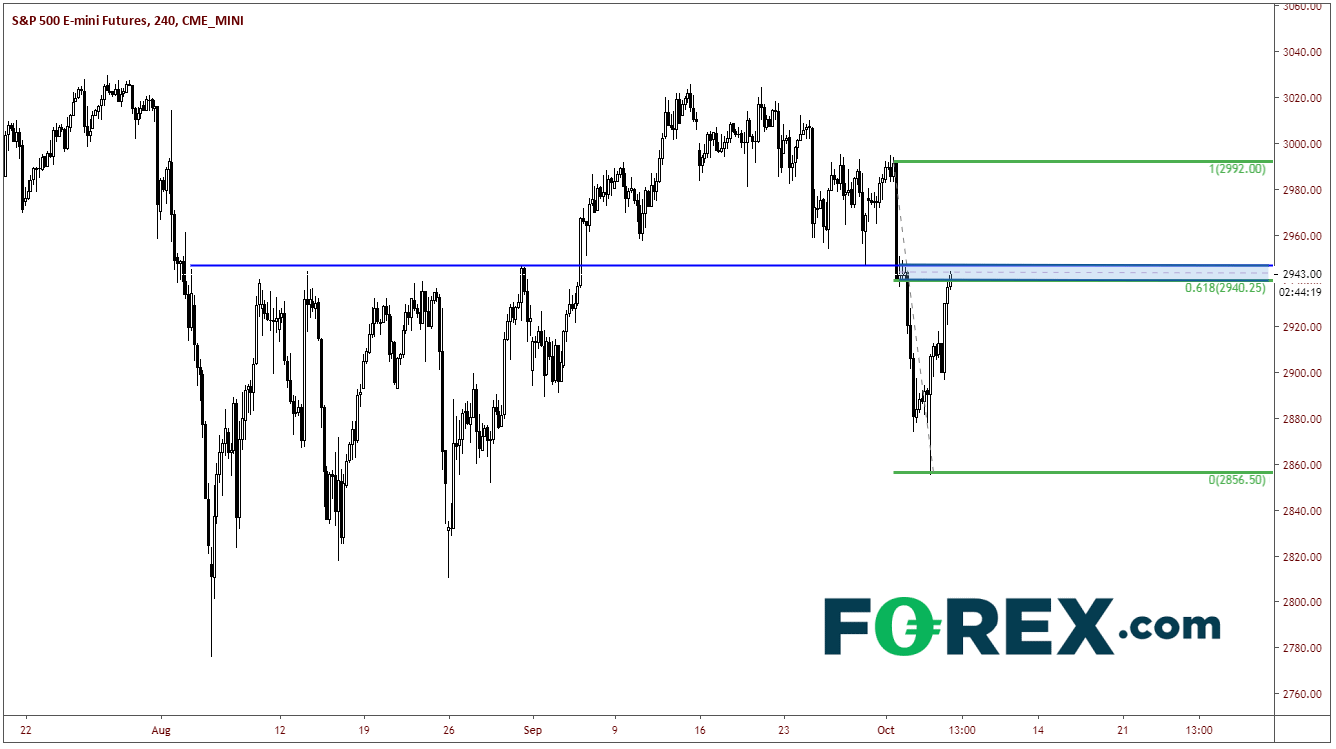
This afternoon, Fed Chairman Powell came out with comments noting that it’s the “Fed’s job to keep the economy expanding as long as possible.” Stocks took this as a signal that the FOMC is cutting at the end of the month and continued the charge higher. On a 240-minute chart, one can see that not only is 2942 an important horizontal level, but it is also near the 61.8% Fibonacci level from the highs before the ISM Manufacturing data to yesterday’s lows! If the S&P500 manages to break through this area of resistance, the index can be up to the downward sloping trending near 2980 very quickly. Above that is the pre-ISM data level at 2992. Support doesn’t come in until yesterday’s highs at 2912.50.
Source: Tradingview, City Index, CME
Towards the end of next week, China is set to come to Washington to discuss trade. Although there is data and Brexit talk that will be out before then, these talks can be a game changer for stocks (not to mention the US Dollar). If a deal is reached, stocks could test the highs near 3050. If no deal is reached and there is nothing in sight, they can be testing last year’s lows again under 2500.
Also, remain on high alert over the weekend for headlines and tweets surrounding the Impeachment Inquiry.
(As of the time of publishing, S&P 500 Futures are trading 2950, trying to squeeze every last short out of this market!!)
After days of disappointing data, S&P 500 Futures (S&Ps) were down nearly 4.5% over the last few days. However, after the benign Nonfarm payrolls were released today, S&Ps continued the rally which began yesterday afternoon, while most of the USD currency pairs remained in tight ranges. Stocks fell yesterday and tested the rising trendline, which dates back to August 6th yesterday, and failed to break though it. Once they failed to move lower below the trendline, price reversed and bounced back to the all-important 2942, which has been a pivotal point for stocks since early in August. It is also the 50 Day Moving Average.
Source: Tradingview, Forex.com, CME
This afternoon, Fed Chairman Powell came out with comments noting that it’s the “Fed’s job to keep the economy expanding as long as possible.” Stocks took this as a signal that the FOMC is cutting at the end of the month and continued the charge higher. On a 240-minute chart, one can see that not only is 2942 an important horizontal level, but it is also near the 61.8% Fibonacci level from the highs before the ISM Manufacturing data to yesterday’s lows! If the S&P500 manages to break through this area of resistance, the index can be up to the downward sloping trending near 2980 very quickly. Above that is the pre-ISM data level at 2992. Support doesn’t come in until yesterday’s highs at 2912.50.
Source: Tradingview, Forex.com, CME
Towards the end of next week, China is set to come to Washington to discuss trade. Although there is data and Brexit talk that will be out before then, these talks can be a game changer for stocks (not to mention the US Dollar). If a deal is reached, stocks could test the highs near 3050. If no deal is reached and there is nothing in sight, they can be testing last year’s lows again under 2500.
Also, remain on high alert over the weekend for headlines and tweets surrounding the Impeachment Inquiry.
(As of the time of publishing, S&P 500 Futures are trading 2950, trying to squeeze every last short out of this market!!)
Related tags:
Latest market news




Open an account in minutes
Experience award-winning platforms with fast and secure execution, and enjoy tight spreads from 0.5 pts on FX and 0.3 pts on indices.
Economic calendar
Web Trader platform
Our sophisticated web-based platform is packed with features.
Related articles
NZD/USD: US yield advantage keeps pressure on the Kiwi
NZD/USD has become unusually sensitive to relative front-end rates, with the US two-year yield advantage now near historically extreme levels.


EUR/USD, Nasdaq Price Outlook: Defining Support Levels in Sight
Defining support levels are coming into focus across key charts, including EUR/USD and the Nasdaq, following the Federal Reserve’s rate hike and a 6% drawdown in UKOIL.


EUR/USD outlook: Hawkish Fed puts euro on the ropes
The Fed delivered a unanimous hike, stronger economic projections and a more hawkish dot plot, giving markets little reason to unwind aggressive tightening bets and keeping the dollar firmly supported.
This report is intended for general circulation only. It should not be construed as a recommendation, or an offer (or solicitation of an offer) to buy or sell any financial products. The information provided does not take into account your specific investment objectives, financial situation or particular needs. Before you act on any recommendation that may be contained in this report, independent advice ought to be sought from a financial adviser regarding the suitability of the investment product, taking into account your specific investment objectives, financial situation or particular needs.
StoneX Financial Pte. Ltd., may distribute reports produced by its respective foreign entities or affiliates within the StoneX group of companies or third parties pursuant to an arrangement under Regulation 32C of the Financial Advisers Regulations. Where the report is distributed to a person in Singapore who is not an accredited investor, expert investor or an institutional investor (as defined in the Securities Futures Act), StoneX Financial Pte. Ltd. accepts legal responsibility to such persons for the contents of the report only to the extent required by law. Singapore recipients should contact StoneX Financial Pte. Ltd. at 6826 9988 for matters arising from, or in connection with the report.
In the case of all other recipients of this report, to the extent permitted by applicable laws and regulations neither StoneX Financial Pte. Ltd. nor its associated companies will be responsible or liable for any loss or damage incurred arising out of, or in connection with, any use of the information contained in this report and all such liability is hereby expressly disclaimed. No representation or warranty is made, express or implied, that the content of this report is complete or accurate.
StoneX Financial Pte. Ltd. is not under any obligation to update this report.
Trading CFDs carries a high level of risk that may not be suitable for some investors. Consider your investment objectives, level of experience, financial resources, risk appetite and other relevant circumstances carefully. The possibility exists that you could lose some or all of your investments, including your initial deposits. If in doubt, please seek independent expert advice. Visit www.forex.com/en-sg/terms-and-policies for the complete Risk Disclosure Statement.