



The Santa Claus Rally: Everything Traders Need to Know
The Santa Claus Rally describes the historical tendency of the stock market to climb during the last five trading days of the year and the first two of the new year.
Share this:

- The Santa Claus Rally describes the historical tendency of the stock market to climb during the last five trading days of the year and the first two of the new year.
- Studies have shown that the Santa Claus Rally exists across different global stock markets and geographies.
- A range of theories have been proposed to explain the Santa Claus Rally, including general optimism around the holidays, a preponderance of retail traders, and the investment of holiday bonuses.
What is the Santa Claus Rally?
The Santa Claus Rally (SCR) refers to a recurring seasonal pattern in the stock market, typically seen during the festive period at the end of December and into early January. This phenomenon, where stock prices have historically rallied more than any other time of the year, has intrigued both casual observers and seasoned analysts.
The Santa Claus Rally: Historical Track Record
Coined by Yale Hirsch in 1972 in the Stock Trader’s Almanac, the Santa Claus Rally describes the historical tendency of the stock market, particularly the S&P 500, to climb during the last five trading days of the year and the first two of the new year.
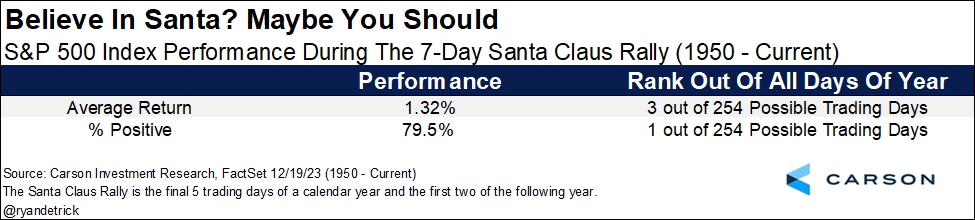
According to Ryan Detrick at Carson Research, these 7 days are more likely to be higher than any other 7 trading days of the year, with the S&P 500 up nearly 80% of the time with an average return of 1.32%, going back to 1950.
Source: Carson Research
There is also some evidence that the Santa Claus rally could have implications for the entire next year. Going back to 1950, if the S&P 500 falls during the last five days of one year and the first two days of the following year, it has historically only returned 5.0% in that next year (vs. 9.1% in all years and 10.2% when the index rallies over the Santa Claus Rally period).
Broadening out beyond just the S&P 500, a 2015 study in the Journal of Financial Planning introduced a more rigorous approach by looking at the price action in three major US indices - the Russell 2000, S&P 500, and Nasdaq Composite – and by examining returns from 15 other developed countries, including predominantly Christian and non-Christian nations alike. The study confirmed the global existence of the SCR, implying that its not just a historical fluke.
While the historical track record is impressive, it's important to acknowledge that the historical tendency for stock markets to rally around the end of the year and the start of the next year is just that: a tendency. There is no guarantee of positive or negative returns over any period, and factors beyond a single seasonal bias will impact markets moving forward.
What Drives the Santa Claus Rally? Not Reindeer!
A range of theories have been proposed to explain this end-of-year uptick.
One popular theory is that the holiday season's general optimism positively impacts investors' sentiments, leading to bullish market behavior. Another suggests that institutional investors, who typically settle their books at the end of the year, step back during this time, allowing retail investors to have a more significant influence. The infusion of holiday bonuses into the market and the slowing down of tax-loss harvesting activities are also considered contributing factors.
While we’re unlikely to ever know exactly what has driven the Santa Claus Rally, the range of plausible explanations above suggests it may be more likely to persist into the future.
The Santa Claus Rally: What You Need to Know
In conclusion, the Santa Claus Rally is more than just a quirky market anomaly; it's a window into the complex interplay of market forces, investor psychology, and seasonal trends. While it's an interesting aspect to consider, wise traders will view it as part of a broader market backdrop, ensuring that any trades align with their preferred indicators and strategy. As with all market trends, it's essential to approach the Santa Claus Rally with a balanced perspective, informed by historical data but grounded in sound trading principles.
-- Written by Matt Weller, Global Head of Research
Follow Matt on Twitter: @MWellerFX
Related tags:



Open an account in minutes
Experience award-winning platforms with fast and secure execution, and enjoy tight spreads from 0.5 pts on FX and 0.3 pts on indices.
Economic calendar
Web Trader platform
Our sophisticated web-based platform is packed with features.
Related articles

RBA delivers 25bp hike, Bullock now the main event
The RBA delivered the expected 25bp hike, but Bullock’s press conference now looms as the bigger volatility risk for AUD/USD and the ASX 200.


Gold Q4 2026 outlook: Resilience in the face of rallying dollar and yields
As we headed towards the latter stages of Q3 and into Q4, the Fed had just hiked rates in a hawkish FOMC meeting, while the likes of the ECB and BoJ had also tightened their respective policies. Oil prices remained elevated amid the prolonged US-Iran conflict. Meanwhile, bond yields were breaking out, and the dollar was higher across the board. Yet, remarkably, gold was still holding in the positive territory for the third quarter, even if it had weakened somewhat in September.


S&P 500 forecast: Stocks extend drop as correction risks grow
US and global equity markets have extended Wednesday’s sell-off, with Wall Street opening lower after a weak handover from Asia and Europe. The deterioration in risk appetite has been spreading across global markets. The dollar was firmer, Treasury yields were holding onto yesterday’s gains, while gold, silver and bitcoin were all under pressure alongside equities and major currencies.
This report is intended for general circulation only. It should not be construed as a recommendation, or an offer (or solicitation of an offer) to buy or sell any financial products. The information provided does not take into account your specific investment objectives, financial situation or particular needs. Before you act on any recommendation that may be contained in this report, independent advice ought to be sought from a financial adviser regarding the suitability of the investment product, taking into account your specific investment objectives, financial situation or particular needs.
StoneX Financial Pte. Ltd., may distribute reports produced by its respective foreign entities or affiliates within the StoneX group of companies or third parties pursuant to an arrangement under Regulation 32C of the Financial Advisers Regulations. Where the report is distributed to a person in Singapore who is not an accredited investor, expert investor or an institutional investor (as defined in the Securities Futures Act), StoneX Financial Pte. Ltd. accepts legal responsibility to such persons for the contents of the report only to the extent required by law. Singapore recipients should contact StoneX Financial Pte. Ltd. at 6826 9988 for matters arising from, or in connection with the report.
In the case of all other recipients of this report, to the extent permitted by applicable laws and regulations neither StoneX Financial Pte. Ltd. nor its associated companies will be responsible or liable for any loss or damage incurred arising out of, or in connection with, any use of the information contained in this report and all such liability is hereby expressly disclaimed. No representation or warranty is made, express or implied, that the content of this report is complete or accurate.
StoneX Financial Pte. Ltd. is not under any obligation to update this report.
Trading CFDs carries a high level of risk that may not be suitable for some investors. Consider your investment objectives, level of experience, financial resources, risk appetite and other relevant circumstances carefully. The possibility exists that you could lose some or all of your investments, including your initial deposits. If in doubt, please seek independent expert advice. Visit www.forex.com/en-sg/terms-and-policies for the complete Risk Disclosure Statement.