







USD/JPY upside getting difficult as US economic data rolls over
USD/JPY is on the backfoot in early June, hit by narrowing yield differentials and a whiff of concern about the trajectory for the US economy. Data releases in the coming days may provide clarity on the answer, providing two-way price risks given elevated levels of uncertainty.
Share this:

- Evidence is accumulating to suggest US economic growth is rolling over
- USD/JPY has been highly influenced by Fed rates expectations recently
- Wednesday’s ISM services report has taken on added significance for markets
USD/JPY is on the backfoot at the start of June, hit by narrowing yield differentials and a whiff of concern about the trajectory for the US economy. Data releases in the coming days may provide clarity on the answer, providing ample two-way price risk given elevated levels of uncertainty.
Asymmetric risks for US rates on display
Risks for US rates were always asymmetric around these levels, with upside far harder won than downside given the higher rates go the more likely it will spark a hard economic landing. We saw that playout on Monday with the ISM non-manufacturing PMI sparking a massive rally across the US Treasury curve, led by the short end which is heavily influenced by Fed rate expectations.
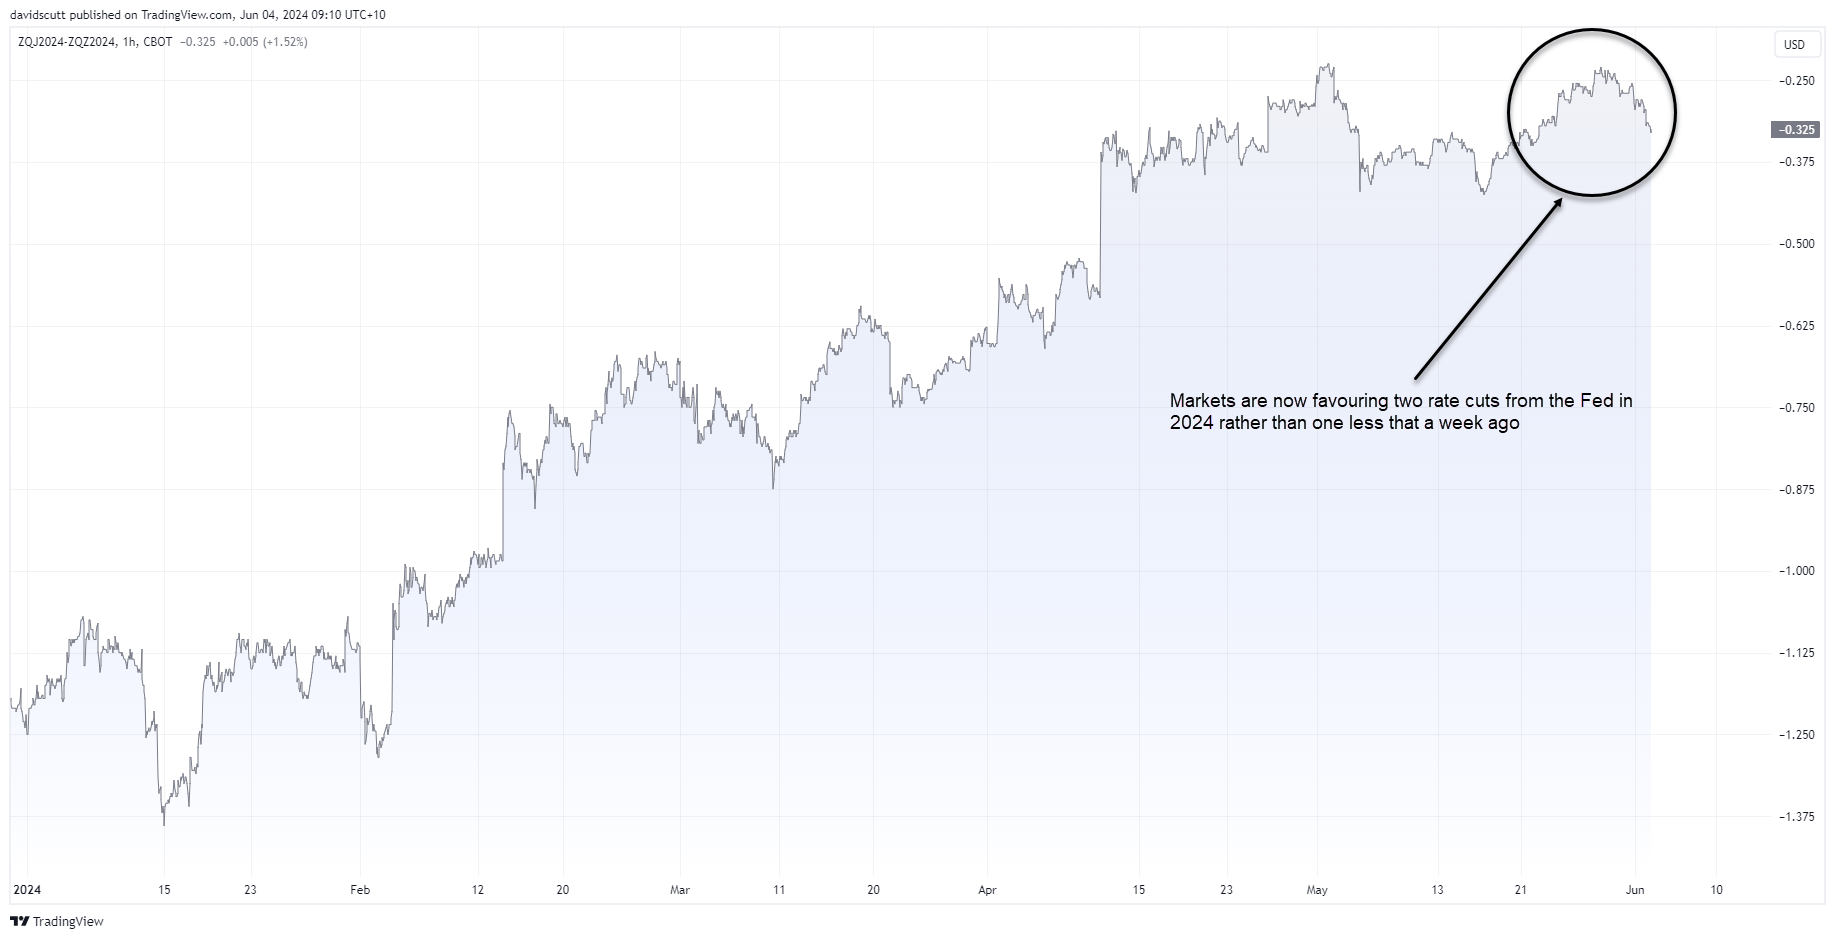
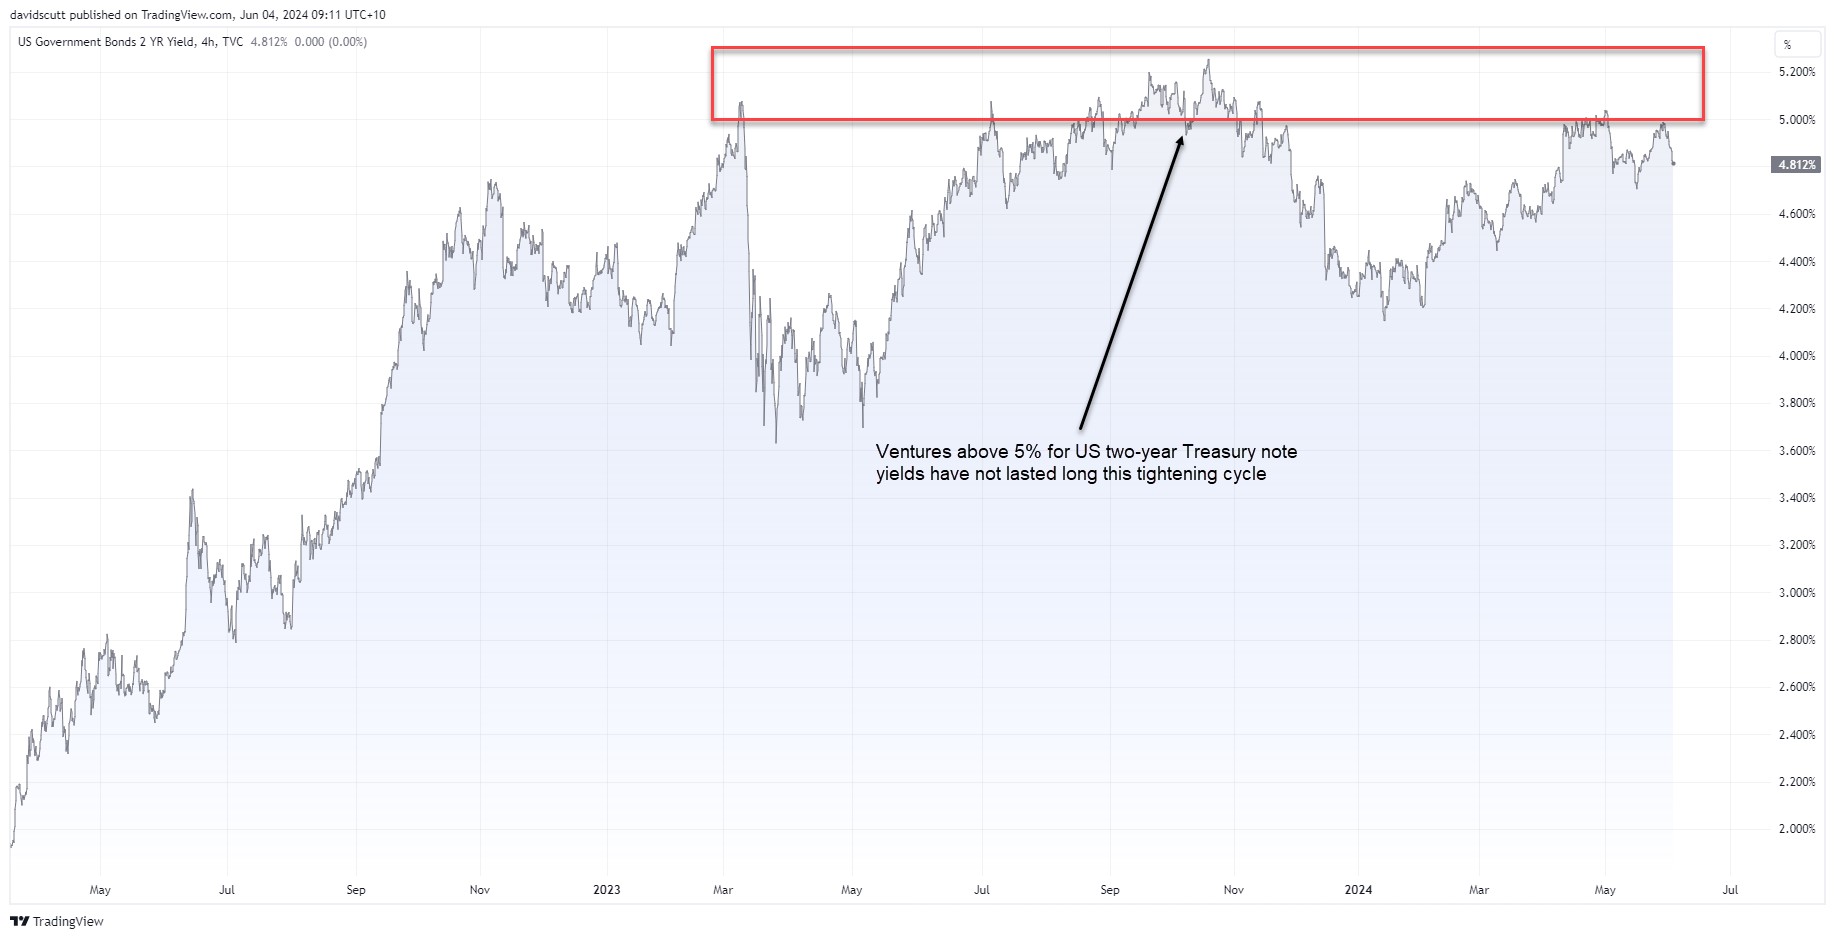
Two-year yields slumped 8 basis points, taking them to within touching distance of a level I’ve described as something of a dividing line for the higher for longer narrative. Markets now favour two rate cuts from the Fed in 2024 rather than one.
So why the big reaction in the bond market? While the detail was undeniably weak with activity contracting at a faster pace in May while lead indicators such as new orders tanked, the substantial bid in bonds was arguably just as much driven by where yields were sitting up until just a few days ago.
Up until last week two-year yields were flirting with 5%, a level they’ve struggled to push beyond throughout this Fed tightening cycle. But with the Fed’s preferred inflation measure, the core PCE deflator, revealing the gradual disinflation trend has resumed after a hot start to the year, focus has now shifted to how activity indicators are holding up.
Abrupt US slowdown already here?
Even before the weak manufacturing PMI came across the screens, evidence was quickly accumulating to suggest growth is rolling over. Citi’s US economic surprise index turned sharply negative, indicating more data than not was surprising to the downside relative to consensus economist forecast. Soft surveys such as the Chicago PMI were outright recessionary.
Personal consumption is also faltering, declining in April once adjusted for inflation, extending the slowdown seen in the first three months of the year. It’s little wonder the Atlanta Fed GDPNow forecast model now has the economy expanding at an annual pace of 1.8% in the June quarter, down nearly two full percentage points on the level indicated two weeks ago.
Source: Atlanta Fed
Just as economic activity has started to splutter, yields were flirting with 2024 highs, likely explaining why the Treasury market reacted so aggressively to one single data point. But now focus is acutely on activity data, any reports that can confirm or question the growth slowdown narrative will be influential not only on bonds but also USD/JPY given its sensitivity to yield differentials.
ISM services takes on added significance
While most pundits are looking to Friday’s nonfarm payrolls report for clarity, Wednesday’s ISM services PMI has now arguably taken on more significance for markets. Unlike lagging payrolls which reflects where the economy is coming from, the services PMI print provides a near real-time measure of activity across the most important part of the US economy. If it confirms the signal in the manufacturing PMI, the reaction could be huge given we're talking about a far more important part of the economy.
For anyone trading USD/JPY or other rate sensitive asset class, this is the report to watch, especially the prices paid, employment and new orders sub-indices. If they weaken noticeably, the likely compression in yield differentials could hammer USD/JPY lower. But if it contradicts the slowdown narrative, as the separate S&P Global US Services PMI report did a fortnight ago, there’s every chance US bond yields and USD/JPY may squeeze higher.
Tuesday’s calendar devoid of major risk events
While it is another busy US calendar on Tuesday, nothing looms as being particularly market moving for USD/JPY unless horribly weak. On that front, the volatile JOLTS survey could dish up anything given you can drive a Mack truck through its margin of error. If you are looking for some form of signal, you’d be better off looking at the quits rate rather than headline figure. People don’t tend to quit unless they’re confident they’ll have a job to go to, right?!
USD/JPY short-term technical outlook
Like the impact on US bond yields, the ISM manufacturing report left its mark on USD/JPY, delivering a fat inverse hammer candle, taking out support at 156.57 and minor uptrend dating back to the start of May. With RSI breaking its uptrend simultaneously, bears have the ascendency near-term.
Should the ISM services report confirm the weakening growth signal in other surveys, minor support at 155.55 may break like a twig in a hurricane, putting USD/JPY on track for a potential test of the 50-day moving average at 154.74.
But if the figure wrongfoots the market and points to economic resilience, USD/JPY may squeeze back above 157 unless it signals sharp softening in services inflation.
-- Written by David Scutt
Follow David on Twitter @scutty
How to trade with City Index
You can trade with City Index by following these four easy steps:
- Open an account, or log in if you’re already a customer
• Open an account in the UK
• Open an account in Australia
• Open an account in Singapore
- Search for the market you want to trade in our award-winning platform
- Choose your position and size, and your stop and limit levels
- Place the trade
Related tags:
Latest market news




Open an account in minutes
Experience award-winning platforms with fast and secure execution, and enjoy tight spreads from 0.5 pts on FX and 0.3 pts on indices.
Economic calendar
Web Trader platform
Our sophisticated web-based platform is packed with features.
Related articles
Gold Q4 2026 outlook: Resilience in the face of rallying dollar and yields
As we headed towards the latter stages of Q3 and into Q4, the Fed had just hiked rates in a hawkish FOMC meeting, while the likes of the ECB and BoJ had also tightened their respective policies. Oil prices remained elevated amid the prolonged US-Iran conflict. Meanwhile, bond yields were breaking out, and the dollar was higher across the board. Yet, remarkably, gold was still holding in the positive territory for the third quarter, even if it had weakened somewhat in September.

USD/JPY Q4 2026 Outlook: Hawkish Fed Pricing Clashes With Intervention Risk
The year-end tug-of-war is clear: hawkish Fed pricing supports USD/JPY, while intervention risk limits the upside.

Japanese Yen Forecast: USD/JPY 4% Rally Challenges Post-Intervention Downtrend 9 24 2026
USD/JPY momentum has shifted sharply higher, putting a major resistance confluence in focus as U.S. and Japanese event risk builds.

This report is intended for general circulation only. It should not be construed as a recommendation, or an offer (or solicitation of an offer) to buy or sell any financial products. The information provided does not take into account your specific investment objectives, financial situation or particular needs. Before you act on any recommendation that may be contained in this report, independent advice ought to be sought from a financial adviser regarding the suitability of the investment product, taking into account your specific investment objectives, financial situation or particular needs.
StoneX Financial Pte. Ltd., may distribute reports produced by its respective foreign entities or affiliates within the StoneX group of companies or third parties pursuant to an arrangement under Regulation 32C of the Financial Advisers Regulations. Where the report is distributed to a person in Singapore who is not an accredited investor, expert investor or an institutional investor (as defined in the Securities Futures Act), StoneX Financial Pte. Ltd. accepts legal responsibility to such persons for the contents of the report only to the extent required by law. Singapore recipients should contact StoneX Financial Pte. Ltd. at 6826 9988 for matters arising from, or in connection with the report.
In the case of all other recipients of this report, to the extent permitted by applicable laws and regulations neither StoneX Financial Pte. Ltd. nor its associated companies will be responsible or liable for any loss or damage incurred arising out of, or in connection with, any use of the information contained in this report and all such liability is hereby expressly disclaimed. No representation or warranty is made, express or implied, that the content of this report is complete or accurate.
StoneX Financial Pte. Ltd. is not under any obligation to update this report.
Trading CFDs carries a high level of risk that may not be suitable for some investors. Consider your investment objectives, level of experience, financial resources, risk appetite and other relevant circumstances carefully. The possibility exists that you could lose some or all of your investments, including your initial deposits. If in doubt, please seek independent expert advice. Visit www.forex.com/en-sg/terms-and-policies for the complete Risk Disclosure Statement.