



Wall Street Outlook: Dow Jones Soars to a Record, Nasdaq Leads the Charge
The Dow Jones reaches a record high while the Nasdaq outperforms, although both indices may be nearing important technical hurdles.
Share this:
Wall Street has rallied to fresh highs as easing geopolitical tensions, lower Fed hike expectations and strong corporate earnings fuel risk appetite. While the Dow Jones has surged to a record high, the Nasdaq has quietly been the week's strongest performer, although both indices are approaching technical hurdles that could challenge the latest advance.
View related analysis:
View related analysis:
Dow Jones Hits a Record High as Nasdaq Outperforms
Falling Geopolitical Risks and Fed Expectations Lift Sentiment
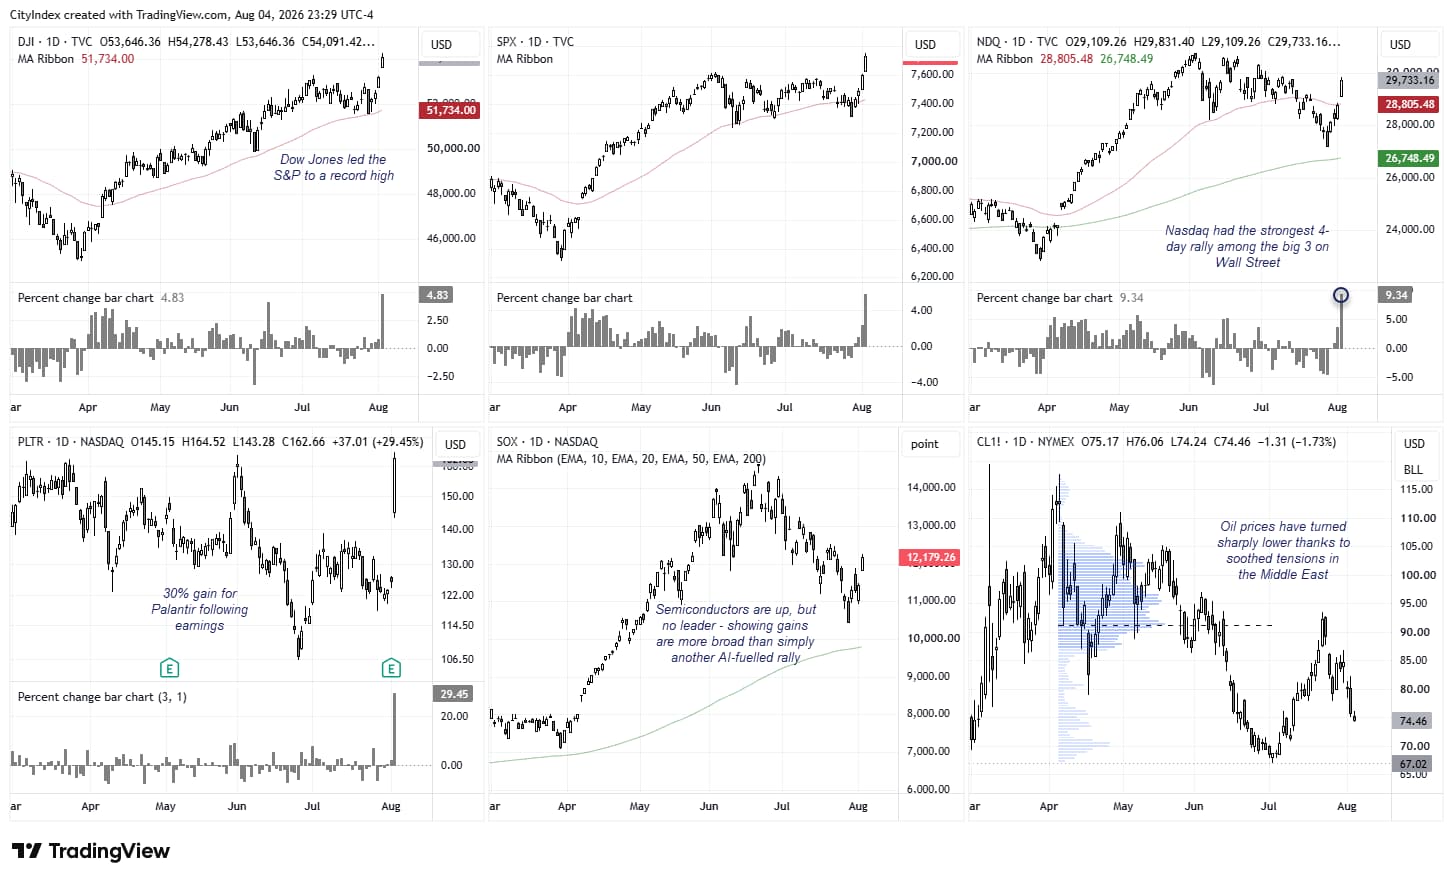
Wall Street has enjoyed a strong week, with the S&P 500 and Dow Jones climbing to fresh record highs. Geopolitical risks have eased, allowing markets to unwind much of the recent "war premium" after Treasury Secretary Scott Bessent said a deal to reopen the Strait of Hormuz could be imminent, triggering a sharp decline in oil prices. This delivers a double dose of good news, as lower crude oil prices help ease inflationary pressures, reduce expectations of further Fed tightening, and support sectors such as airlines, transportation, consumer discretionary and technology.
Markets were pricing in two Fed rate hikes just a week ago, but expectations have since eased considerably. Fed funds futures now imply just a 57% probability of a single 25bp rate hike in September.
Source: NASDAQ, NYMEX, TradingView
Strong Earnings and Broader Market Participation Support the Rally
Corporate earnings have also underpinned the rally. Palantir (PLTR) surged 30% after another blowout quarter, while Caterpillar (CAT) beat expectations with record sales, supported by infrastructure spending and AI-related data centre demand. Strong results from Microsoft and Alphabet have further reinforced confidence that AI investment is continuing to generate meaningful revenue rather than simply consuming capital.
The Philadelphia Semiconductor Index (SOX) has also rebounded sharply following July's correction, with investors rotating back into Nvidia, Broadcom, Micron, AMD and other AI infrastructure plays.
It is also worth noting that Wall Street's rebound has broadened beyond AI, with financials and industrials also contributing to the advance. That points to improving market breadth rather than another narrow, technology-led rally.
Dow Jones Technical Outlook: Is the Rally Becoming Overextended?
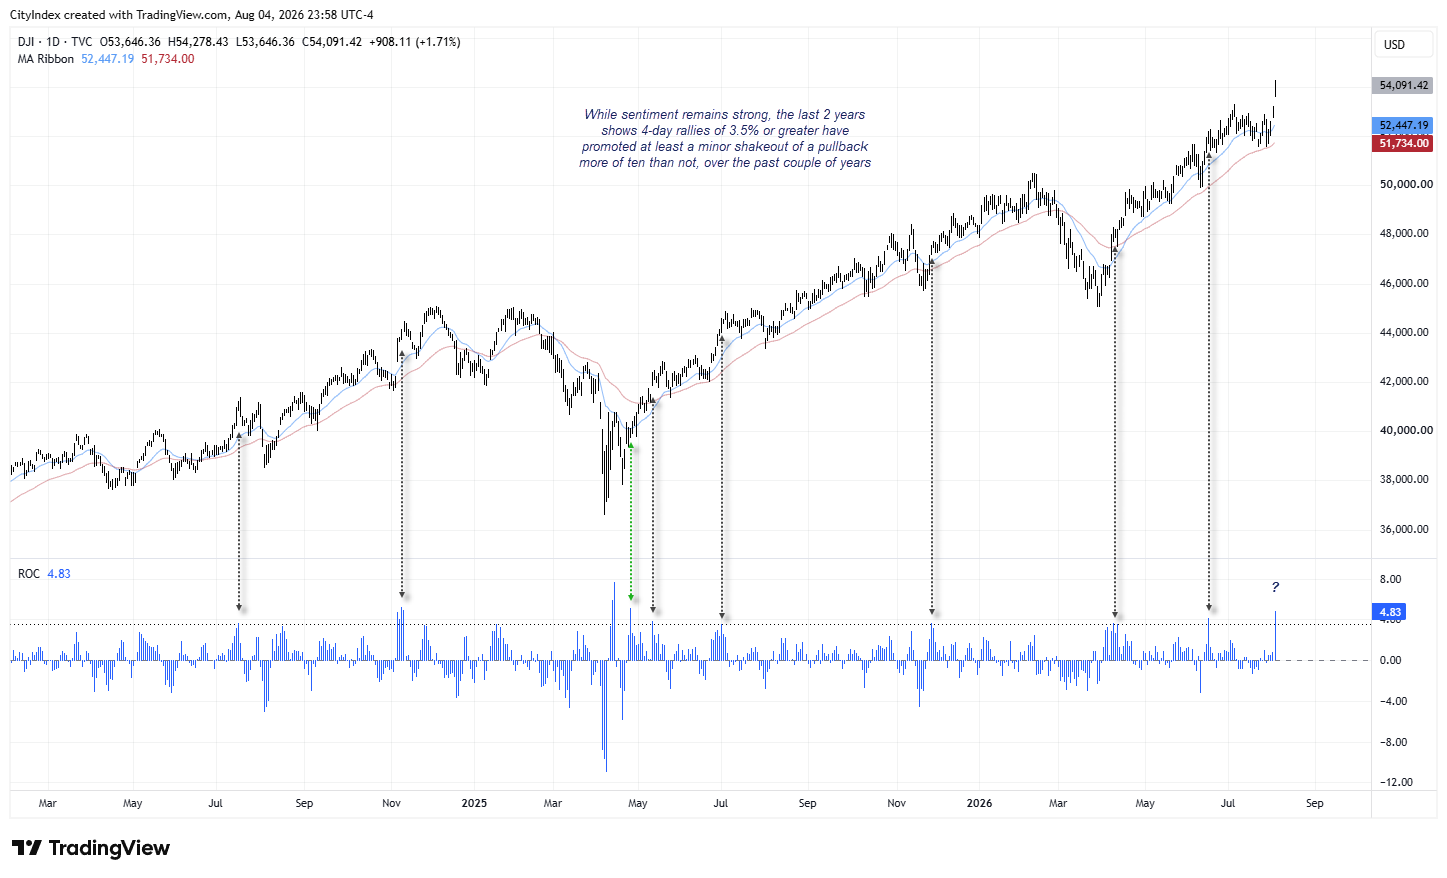
While bullish momentum and sentiment are clearly behind Wall Street, traders should also be wary of chasing the rally at record highs. Momentum can persist for longer than many expect, but data from the past couple of years suggest the Dow Jones may be approaching an inflection point, leaving the risk-reward balance less favourable than the headlines might imply.
The Dow Jones cash index has rallied 4.8% since last Wednesday's close. Zooming out, the four-day Rate of Change (ROC) indicator shows the market has often peaked within a few days of the ROC rising above 3.5%.
Of course, past performance is no guarantee of future results, and if the market wants to rally another 5% from here, it certainly could. However, traders tempted to chase the move at record highs should also consider the potential for a period of consolidation or a pullback after such a strong advance.
Source: TradingView


Nasdaq 100 Futures (NQ) Technical Analysis
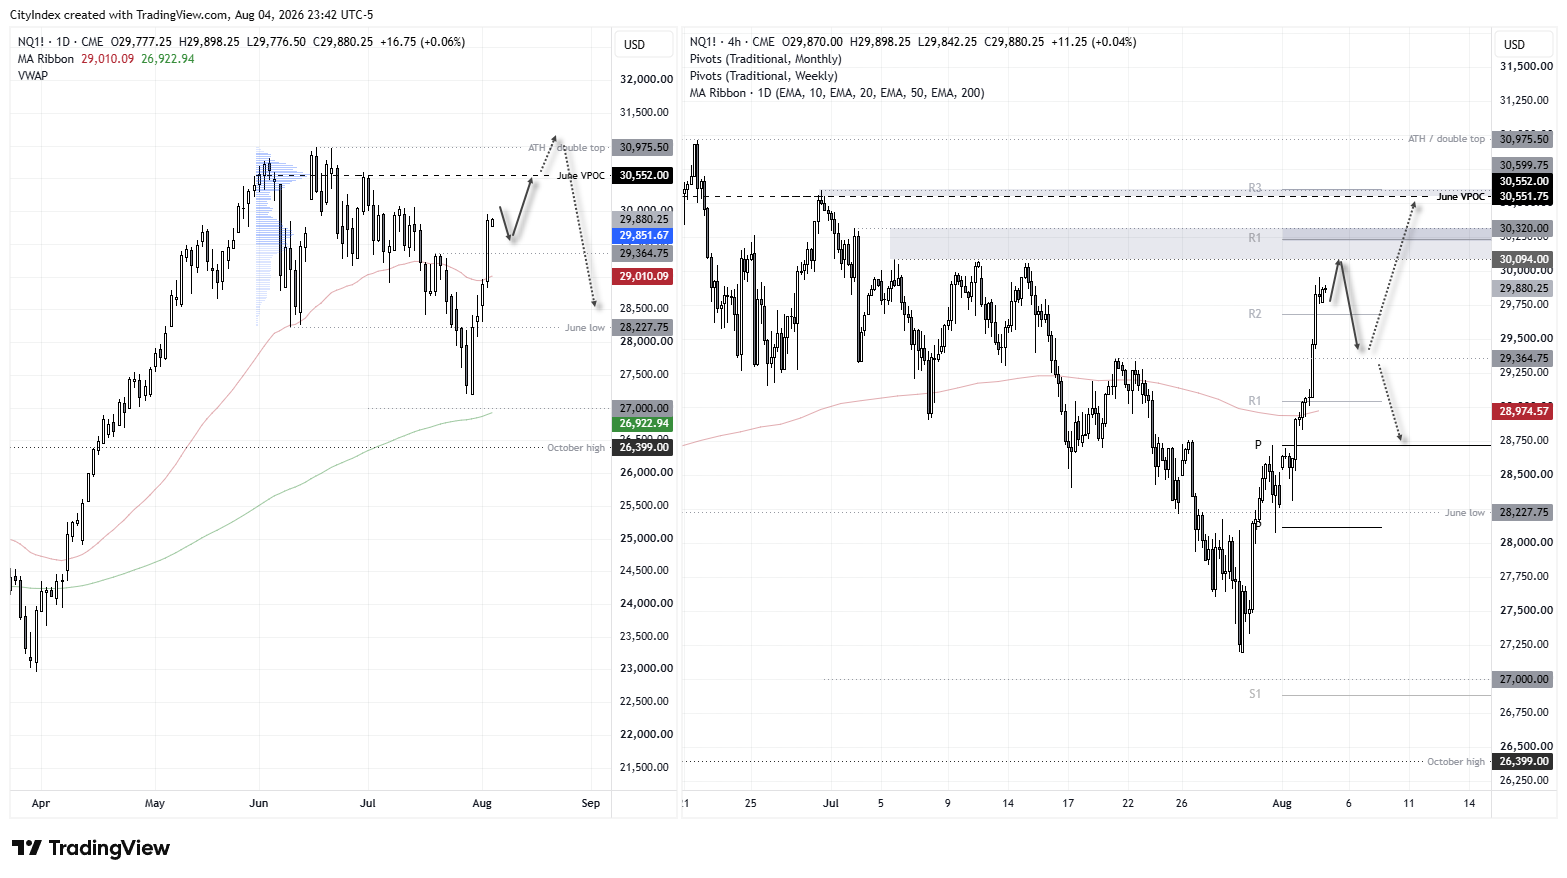
The Nasdaq may be lagging Wall Street in the sense that it has yet to join the Dow Jones and S&P 500 at record highs, but it has been the week's strongest performer. Unlike its peers, which are trading in uncharted territory, the Nasdaq also offers traders clearer technical support and resistance levels to work with.
The 29,364 high could become a pivotal level over the near term should prices retrace. While the index remains above Tuesday's low, the 29,000 handle and the 50-day EMA, the bias favours buying dips.
The 30,000 level is the next major hurdle for Nasdaq futures. However, with the psychological 30,000 level sitting just below the 31,000 handle and a cluster of prior swing highs, the upside could become increasingly challenging from here. A final push higher cannot be ruled out, but with the Dow Jones appearing stretched and the Nasdaq approaching a significant resistance zone, I suspect gains may become more limited before a pullback towards support within the current four-day range.
Source: CME
- Bulls could seek dips while the Nasdaq holds above 29,000, the 50-day EMA and Tuesday's low.
- The 30,000 level may prove a key test for Nasdaq bulls, with additional resistance just below 31,000.
- Dow Jones momentum appears increasingly stretched, raising the potential for consolidation after its record-breaking run.
- Improving market breadth supports the broader uptrend, although overhead resistance may limit gains over the near term.
View the full economic calendar
View the full economic calendar
-- Written by Matt Simpson
Follow Matt on Twitter @cLeverEdge
How to trade with City Index
You can trade with City Index by following these four easy steps:
- Open an account, or log in if you’re already a customer
• Open an account in the UK
• Open an account in Australia
• Open an account in Singapore
- Search for the market you want to trade in our award-winning platform
- Choose your position and size, and your stop and limit levels
- Place the trade
Related tags:


Open an account in minutes
Experience award-winning platforms with fast and secure execution, and enjoy tight spreads from 0.5 pts on FX and 0.3 pts on indices.
Economic calendar
Web Trader platform
Our sophisticated web-based platform is packed with features.
Related articles
USD/JPY forecast: US dollar strengths amid hawkish Fed despite recent oil weakness
The US dollar has extended its gains this morning, even if oil prices finished lower for the fifth consecutive day yesterday. Oil prices have bounced back in this first half of today’s session, causing a bit of pressure on currencies that rely on energy imports such as the euro, pound, Swiss franc, and Japanese yen. But it was the dollar that was exerting the most pressure, amid hawkish FedSpeak. Meanwhile, European indices and precious metals were also under a bit of pressure amid the strength of the dollar.

USD/JPY and USD/CHF Could Diverge as CHF/JPY Approaches Resistance
USD/JPY and USD/CHF retain bullish structures, but CHF/JPY resistance could expose a divergence between the two US dollar pairs.

EUR/AUD, GBP/AUD Outlook: Rates, risk and metals reinforce bearish technical case
EUR/AUD and GBP/AUD are coiling near support, with recent correlations suggesting the Aussie’s strength is being driven more by rates, risk and metals than energy.

This report is intended for general circulation only. It should not be construed as a recommendation, or an offer (or solicitation of an offer) to buy or sell any financial products. The information provided does not take into account your specific investment objectives, financial situation or particular needs. Before you act on any recommendation that may be contained in this report, independent advice ought to be sought from a financial adviser regarding the suitability of the investment product, taking into account your specific investment objectives, financial situation or particular needs.
StoneX Financial Pte. Ltd., may distribute reports produced by its respective foreign entities or affiliates within the StoneX group of companies or third parties pursuant to an arrangement under Regulation 32C of the Financial Advisers Regulations. Where the report is distributed to a person in Singapore who is not an accredited investor, expert investor or an institutional investor (as defined in the Securities Futures Act), StoneX Financial Pte. Ltd. accepts legal responsibility to such persons for the contents of the report only to the extent required by law. Singapore recipients should contact StoneX Financial Pte. Ltd. at 6826 9988 for matters arising from, or in connection with the report.
In the case of all other recipients of this report, to the extent permitted by applicable laws and regulations neither StoneX Financial Pte. Ltd. nor its associated companies will be responsible or liable for any loss or damage incurred arising out of, or in connection with, any use of the information contained in this report and all such liability is hereby expressly disclaimed. No representation or warranty is made, express or implied, that the content of this report is complete or accurate.
StoneX Financial Pte. Ltd. is not under any obligation to update this report.
Trading CFDs carries a high level of risk that may not be suitable for some investors. Consider your investment objectives, level of experience, financial resources, risk appetite and other relevant circumstances carefully. The possibility exists that you could lose some or all of your investments, including your initial deposits. If in doubt, please seek independent expert advice. Visit www.forex.com/en-sg/terms-and-policies for the complete Risk Disclosure Statement.