


Nasdaq Could Look to KOSPI for Directional Clues Beyond Earnings
The KOSPI is testing a major support level that could offer directional clues for the Nasdaq and Nikkei as earnings season gets underway.
Share this:

The KOSPI's sharp selloff has become a key barometer for global technology sentiment, given South Korea's central role in the AI semiconductor supply chain through Samsung Electronics and SK Hynix. Now more than 30% below its record high, the index has been hit by a broad unwind in AI-related stocks, concerns over the outlook for chip demand, and a surprise rate hike from the Bank of Korea
The weakness has spilled over into regional equity markets, with the Nikkei 225 proving more sensitive to the semiconductor-led selloff than the Nasdaq in recent weeks. Wall Street indices have also come under pressure as earnings season gets underway. Against that backdrop, the KOSPI is attempting to hold a key technical support level. Whether buyers can defend it or bears force a decisive break lower, could prove pivotal for technology sentiment and broader equity markets.
View related analysis:
View related analysis:
KOSPI Tests Major Support After Sharp Selloff
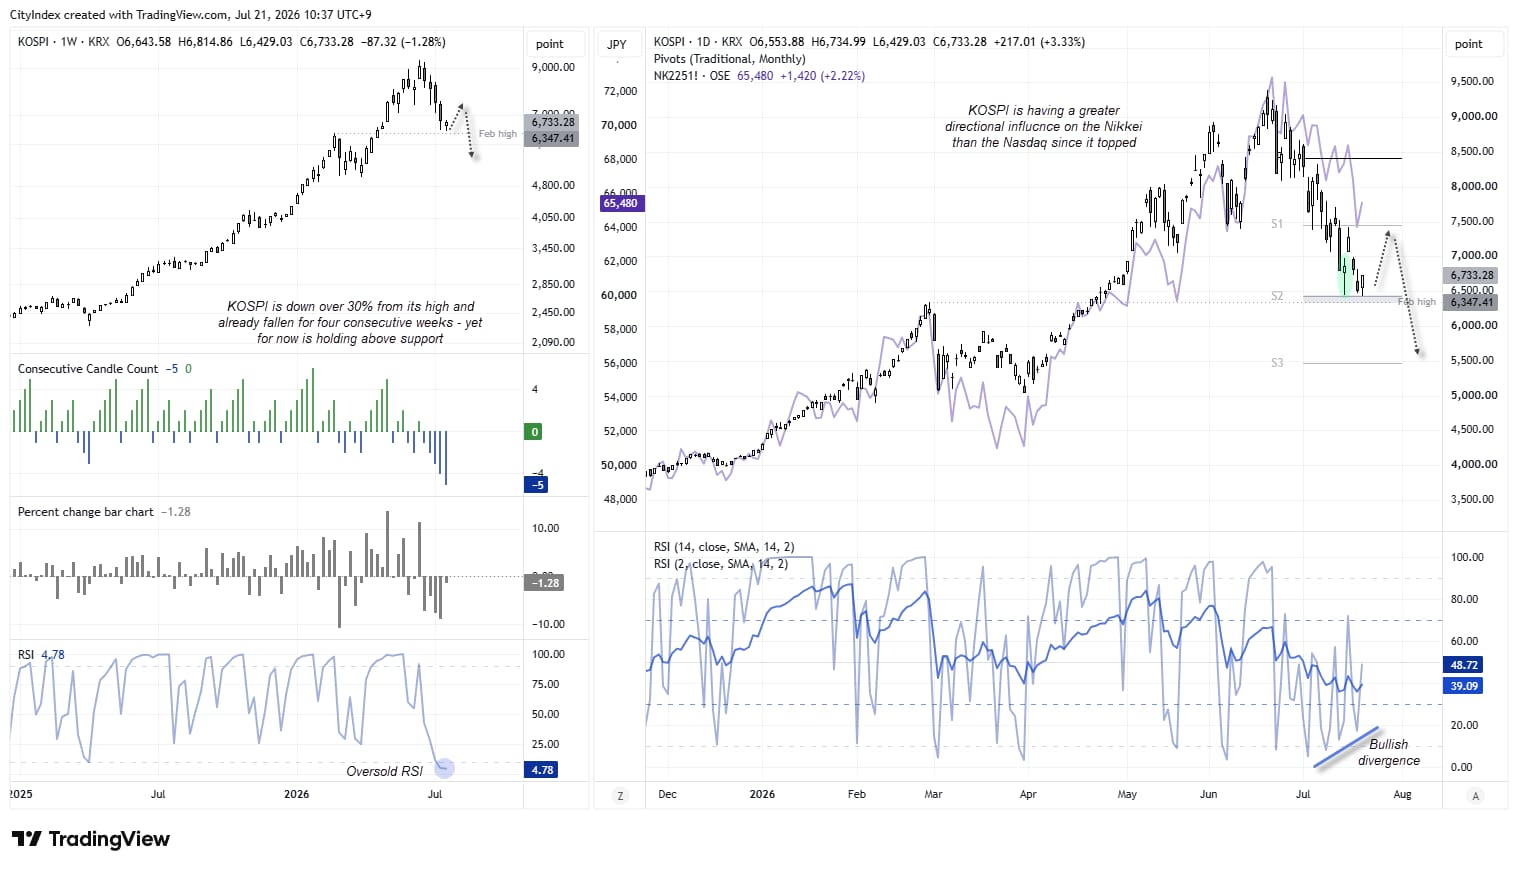
The weekly chart shows the KOSPI has fallen for four consecutive weeks and is on track for a fifth. It has not recorded a five-week losing streak since August 2024, with bearish runs typically ending after two to three weeks over the past couple of years. With the RSI (2) deeply oversold and prices holding above the February high, dip buyers may be waiting in the wings.
The daily chart shows a bullish divergence on the RSI (2), while prices continue to hold above last week's bullish pinbar low. Buyers have also stepped in today to lift the KOSPI back above 6,500.
Source: KRK, TradingView


Nasdaq 100 Futures (NQ) Technical Analysis
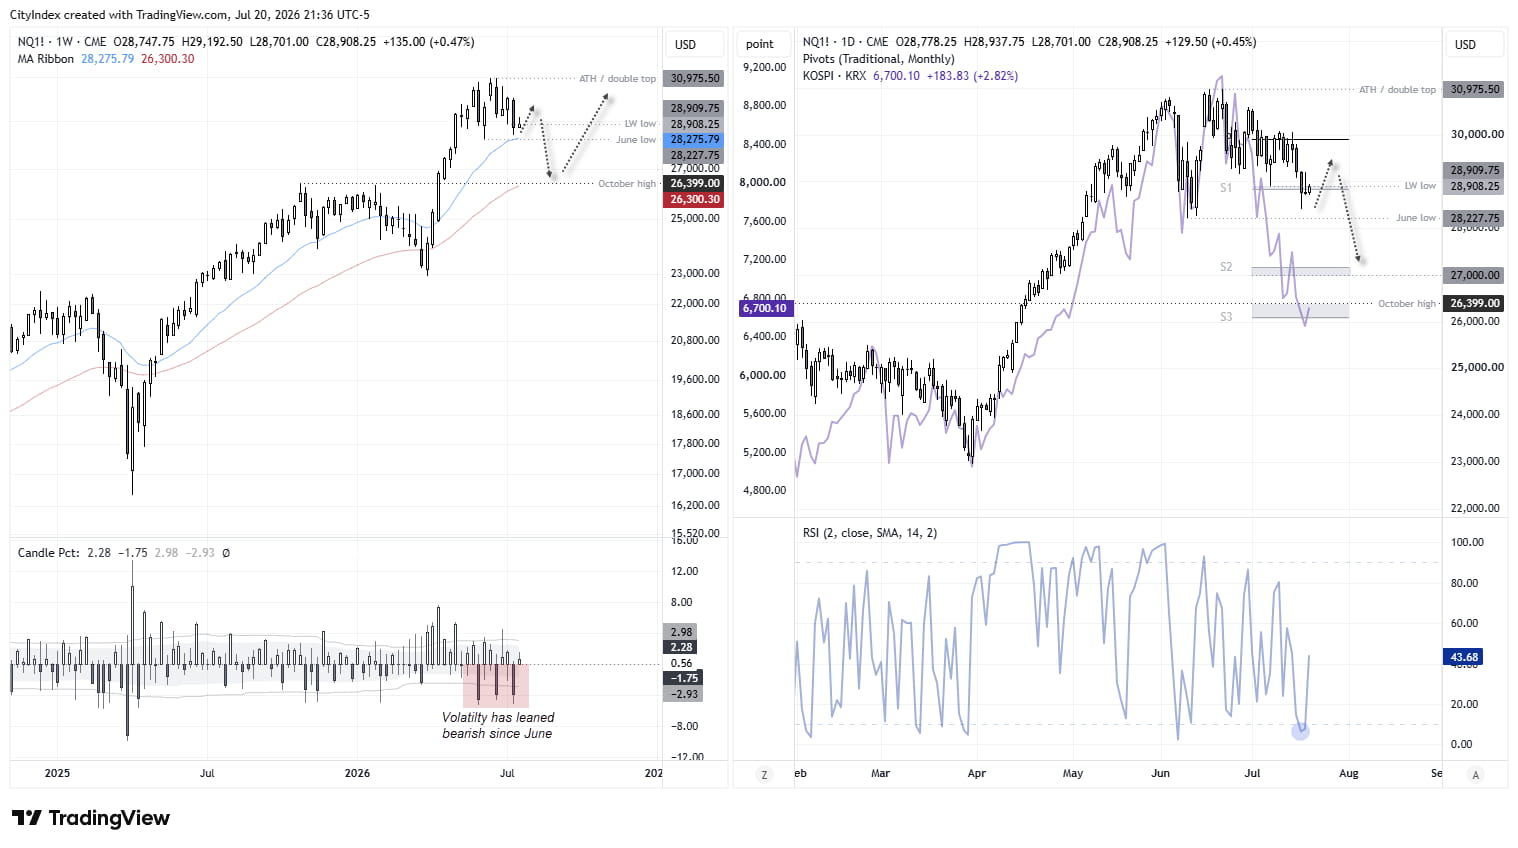
The weekly chart shows prices remain in the lower half of last week's bearish candle. Notice that volatility has favoured bears since June, with the three largest candle bodies all to the downside at around 4%. The June low (28,227) is a key support level for bears to monitor, as a break beneath it would also see prices slip below the 20-week EMA and suggest a deeper correction is underway. The next major support level is the October high (26,399), although the monthly S2 pivot point near the 27,000 handle could provide interim support if a deeper pullback unfolds.
Volatility has favoured bears since June, with the three largest weekly candle bodies all to the downside at around 4%. While the Nasdaq's pullback has been far less severe, whether prices retest the June low or rebound from current levels may ultimately depend on whether KOSPI bulls can defend their own key support level.
Source: CME, TradingView
Nasdaq 100 intraday Levels
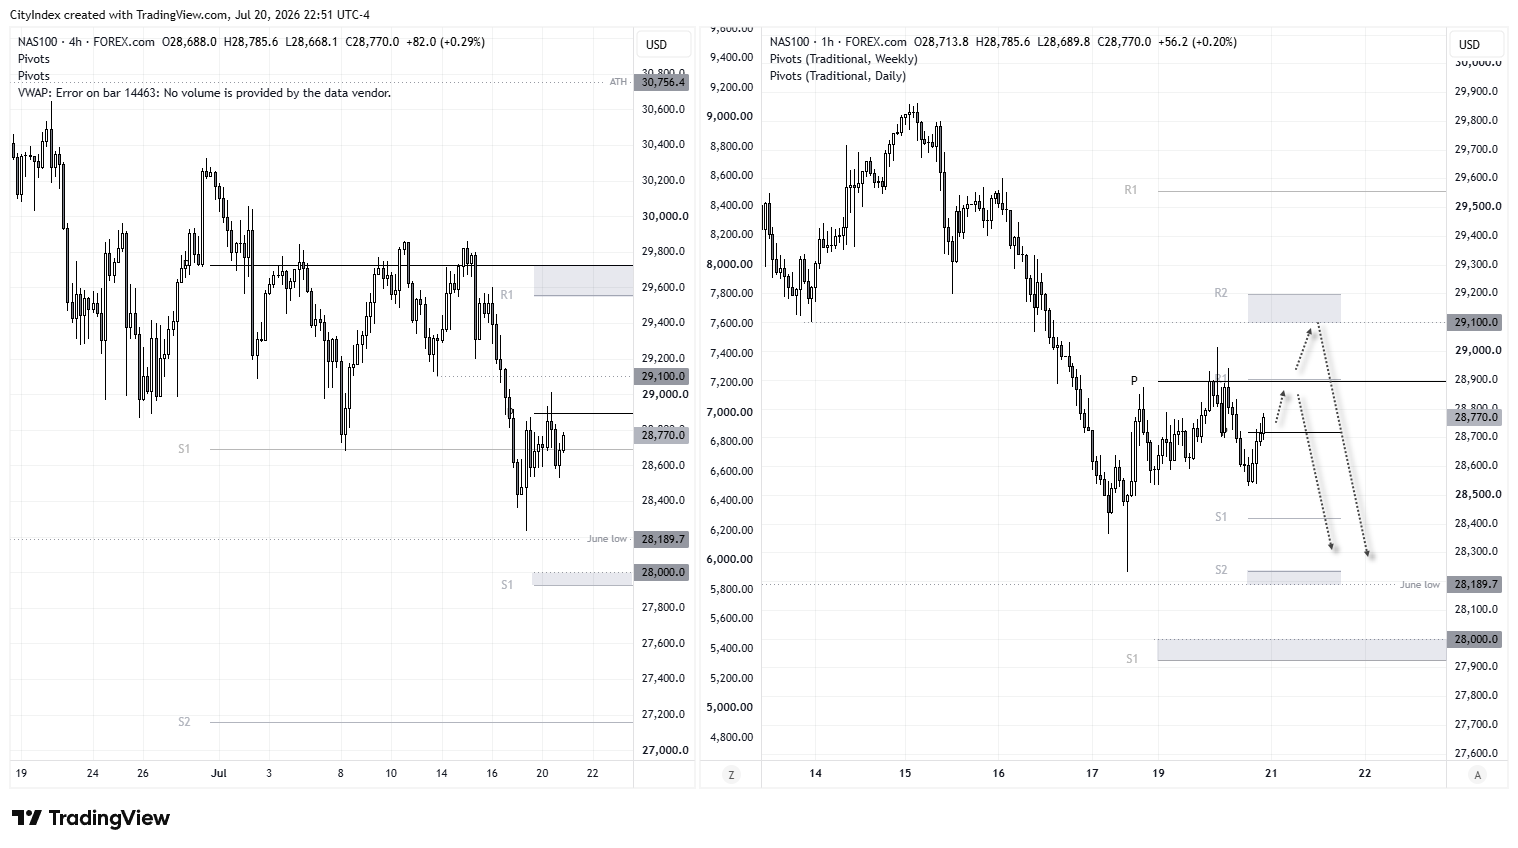
Momentum has been moving predominantly lower on the 4-hour chart, although prices are grinding higher as part of a countertrend move. If the Nasdaq breaks above its weekly pivot point and the daily R1 near 28,900, the 29,100 low and weekly R2 pivot come into view. This could provide a potential resistance zone for bears to fade into or look for evidence of a swing high, on the assumption another leg lower unfolds. The June low could then come back into focus, with a break below it suggesting a deeper pullback is underway.
Risks to my downside bias include stronger-than-expected earnings and a solid rebound in the KOSPI.
Source: Forex.com, TradingView
View the full economic calendar
View the full economic calendar
-- Written by Matt Simpson
Follow Matt on Twitter @cLeverEdge
How to trade with City Index
You can trade with City Index by following these four easy steps:
- Open an account, or log in if you’re already a customer
• Open an account in the UK
• Open an account in Australia
• Open an account in Singapore
- Search for the market you want to trade in our award-winning platform
- Choose your position and size, and your stop and limit levels
- Place the trade
Related tags:


Open an account in minutes
Experience award-winning platforms with fast and secure execution, and enjoy tight spreads from 0.5 pts on FX and 0.3 pts on indices.
Economic calendar
Web Trader platform
Our sophisticated web-based platform is packed with features.
Related articles

Nikkei breakout accelerates as yen weakness returns
Nikkei has started October with a powerful breakout, helped by renewed yen weakness and strong upside momentum


S&P 500 Forecast: SPX Continues to Drift Away from Record Highs
Recent trading sessions have done little to restore confidence in the equity market. Over the last four sessions, the S&P 500 has declined by nearly 1.00%, a move that highlights growing short-term weakness and keeps the index moving further away from its record-high territory.


Nasdaq Breakout Potential into Q4 for Melt Up Scenarios
The headlines seem negative in almost any place that you look, with surging Treasury yields and frothy AI valuations getting more and more attention. But, if it’s so bad, why hasn’t the Nasdaq melted down yet, even as the Fed has started hiking rates?

This report is intended for general circulation only. It should not be construed as a recommendation, or an offer (or solicitation of an offer) to buy or sell any financial products. The information provided does not take into account your specific investment objectives, financial situation or particular needs. Before you act on any recommendation that may be contained in this report, independent advice ought to be sought from a financial adviser regarding the suitability of the investment product, taking into account your specific investment objectives, financial situation or particular needs.
StoneX Financial Pte. Ltd., may distribute reports produced by its respective foreign entities or affiliates within the StoneX group of companies or third parties pursuant to an arrangement under Regulation 32C of the Financial Advisers Regulations. Where the report is distributed to a person in Singapore who is not an accredited investor, expert investor or an institutional investor (as defined in the Securities Futures Act), StoneX Financial Pte. Ltd. accepts legal responsibility to such persons for the contents of the report only to the extent required by law. Singapore recipients should contact StoneX Financial Pte. Ltd. at 6826 9988 for matters arising from, or in connection with the report.
In the case of all other recipients of this report, to the extent permitted by applicable laws and regulations neither StoneX Financial Pte. Ltd. nor its associated companies will be responsible or liable for any loss or damage incurred arising out of, or in connection with, any use of the information contained in this report and all such liability is hereby expressly disclaimed. No representation or warranty is made, express or implied, that the content of this report is complete or accurate.
StoneX Financial Pte. Ltd. is not under any obligation to update this report.
Trading CFDs carries a high level of risk that may not be suitable for some investors. Consider your investment objectives, level of experience, financial resources, risk appetite and other relevant circumstances carefully. The possibility exists that you could lose some or all of your investments, including your initial deposits. If in doubt, please seek independent expert advice. Visit www.forex.com/en-sg/terms-and-policies for the complete Risk Disclosure Statement.