



Japanese Yen Outlook: USD/JPY Plunge Loses Steam, but Risks Remain
USD/JPY is attempting to stabilise after its sharpest 2-day decline in 4 years, but Fed-backed support for Japan could keep rallies on a short leash.
Share this:

USD/JPY is trying to stabilise after its sharpest four-day loss in nearly two years, but the outlook remains fragile. Japan's intervention, backed by the US Treasury and supported by a new Fed repo facility, has increased the credibility of future yen-buying operations, leaving traders alert for opportunities to fade rallies.
View related analysis:
View related analysis:
Why USD/JPY Risks Remain Despite the Sharp Selloff
Fed Support Adds Weight to Yen Intervention
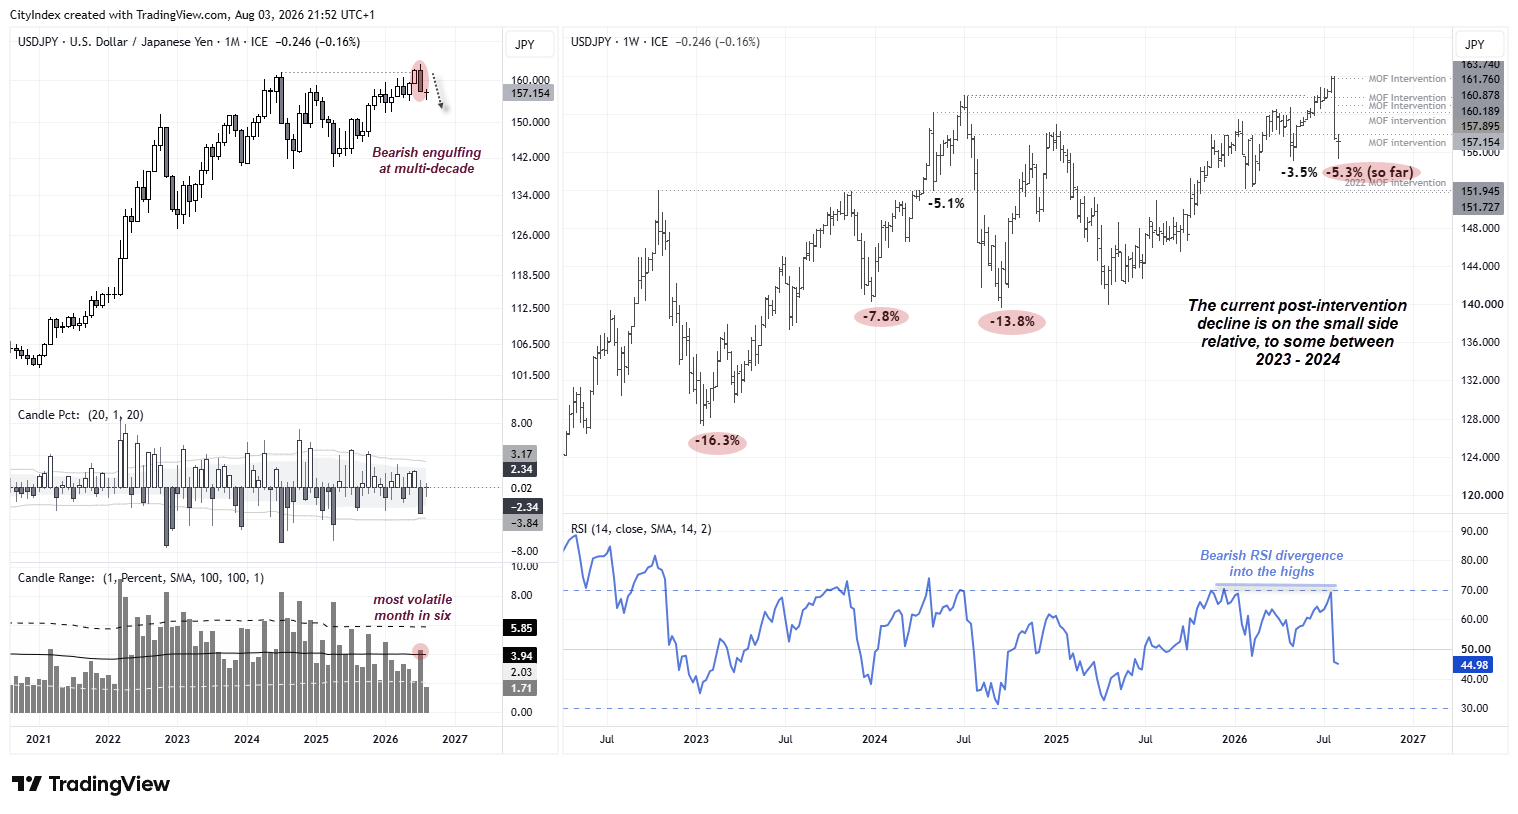
The -3.2% loss for July marked the worst month for USD/JPY in fifteen and its most volatile trading range in six. Most of that loss occurred in the final two days of the month, thanks to intervention from Japan's Ministry of Finance (MOF) and support from the US Treasury. Traders remain on guard for further declines after the MOF vowed to intervene again, with the Fed making that easier by opening a repo facility for Japan. This allows Japan to borrow US dollars against its Treasury holdings to buy yen instead of selling US Treasuries, removing a key constraint on future intervention.
In simple terms, the facility gives Japan greater firepower to sell US dollars and buy yen, increasing bearish pressure on the greenback if authorities intervene again.
Source: ICE, TradingView
History Shows MOF Intervention Can Trigger Sharp USD/JPY Declines
The weekly chart shows how deep USD/JPY corrections have been following MOF interventions. The pair has already fallen 5.3%, surpassing the post-intervention decline seen in April, although it still trails the deeper selloffs following MOF action in October 2022, November 2023 and July 2024.
Whether we'll see declines of a similar magnitude this time remains debatable, given the potential for further Fed rate hikes and persistent inflationary pressures from higher crude oil prices amid ongoing Middle East tensions. However, with the US Treasury and Fed backing Japan, MOF jawboning is more likely to cap rallies, while any future interventions now carry greater credibility. That could keep USD/JPY and other yen crosses firmly on traders' 'fade the rally' watchlists.


USD/JPY Technical Analysis: US Dollar vs Japanese Yen
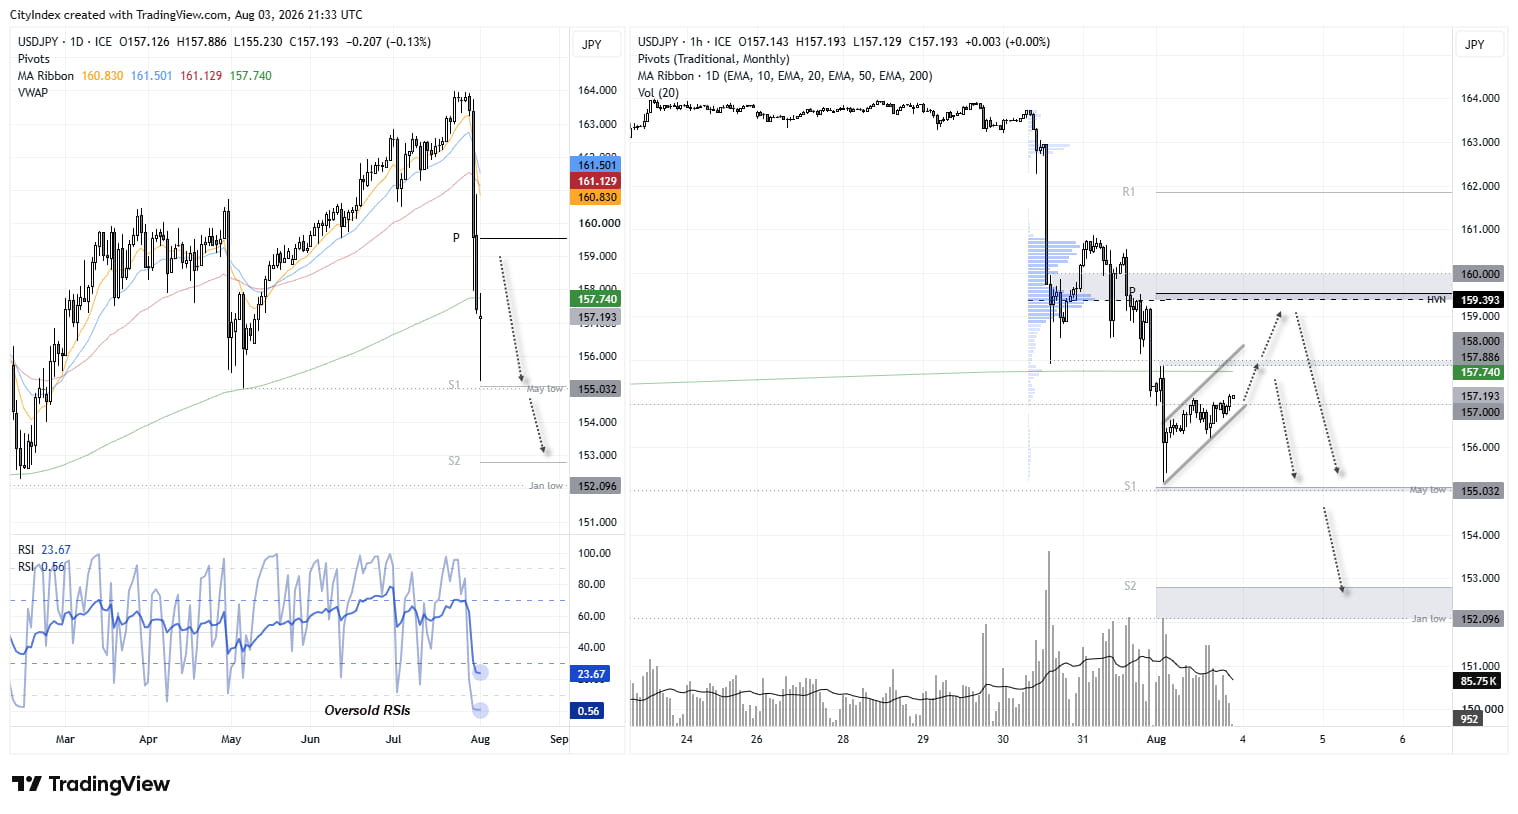
The daily chart shows the intense two-day selloff on Thursday and Friday culminated in a volatile doji. Notably, the session low held above the 155.00 handle, the May low and the monthly S1 pivot point. With the daily RSI also deeply oversold, bears may want to tread cautiously around these lows.
The 1-hour chart shows prices grinding higher in what could be a corrective pattern, while declining volumes suggest a lack of conviction among bulls. Even so, they may still attempt a move towards the 200-period EMA. If the MOF allows, a break above 158.00 brings the high-volume node (HVN) and monthly pivot point into focus around the 159.00 handle.
Should prices bounce from here, bears may look to fade rallies into those resistance levels, particularly with the backing of the MOF and Fed. A break below 155.00 would then bring the January low near 152.00 into focus.
Source: ICE, TradingView
View the full economic calendar
View the full economic calendar
-- Written by Matt Simpson
Follow Matt on Twitter @cLeverEdge
How to trade with City Index
You can trade with City Index by following these four easy steps:
- Open an account, or log in if you’re already a customer
• Open an account in the UK
• Open an account in Australia
• Open an account in Singapore
- Search for the market you want to trade in our award-winning platform
- Choose your position and size, and your stop and limit levels
- Place the trade
Related tags:
Latest market news




Open an account in minutes
Experience award-winning platforms with fast and secure execution, and enjoy tight spreads from 0.5 pts on FX and 0.3 pts on indices.
Economic calendar
Web Trader platform
Our sophisticated web-based platform is packed with features.
Related articles
USD/CHF Feels the Weight of US Midterms, USD/CAD Clings to Support
US midterms threaten fresh dollar volatility as USD/CHF tests technical support and USD/CAD clings to 1.3940 ahead of election results.
US Dollar, GBP/USD, USD/CAD, USD/CHF, Gold Weekly Technical Outlook 11 2 2026
Sr. Technical Strategist Michael Boutros highlights the levels that matter on the USD Majors, commodities, and equity indices charts this week.

US Midterm Forecast: The Key Risks for Traders to Watch Through the US Elections
Prediction markets are pricing in nearly 75% odds of a Democratic sweep in this week’s US midterm elections, a development that would result in a split from the single party Republican rule of the past two years - what will it mean for markets?

This report is intended for general circulation only. It should not be construed as a recommendation, or an offer (or solicitation of an offer) to buy or sell any financial products. The information provided does not take into account your specific investment objectives, financial situation or particular needs. Before you act on any recommendation that may be contained in this report, independent advice ought to be sought from a financial adviser regarding the suitability of the investment product, taking into account your specific investment objectives, financial situation or particular needs.
StoneX Financial Pte. Ltd., may distribute reports produced by its respective foreign entities or affiliates within the StoneX group of companies or third parties pursuant to an arrangement under Regulation 32C of the Financial Advisers Regulations. Where the report is distributed to a person in Singapore who is not an accredited investor, expert investor or an institutional investor (as defined in the Securities Futures Act), StoneX Financial Pte. Ltd. accepts legal responsibility to such persons for the contents of the report only to the extent required by law. Singapore recipients should contact StoneX Financial Pte. Ltd. at 6826 9988 for matters arising from, or in connection with the report.
In the case of all other recipients of this report, to the extent permitted by applicable laws and regulations neither StoneX Financial Pte. Ltd. nor its associated companies will be responsible or liable for any loss or damage incurred arising out of, or in connection with, any use of the information contained in this report and all such liability is hereby expressly disclaimed. No representation or warranty is made, express or implied, that the content of this report is complete or accurate.
StoneX Financial Pte. Ltd. is not under any obligation to update this report.
Trading CFDs carries a high level of risk that may not be suitable for some investors. Consider your investment objectives, level of experience, financial resources, risk appetite and other relevant circumstances carefully. The possibility exists that you could lose some or all of your investments, including your initial deposits. If in doubt, please seek independent expert advice. Visit www.forex.com/en-sg/terms-and-policies for the complete Risk Disclosure Statement.