




WTI Crude Oil Charts: Oil Demand vs FOMC Statement
WTI Crude Oil takes a dive as market anticipations steer the wheel towards lower demand expectations
Share this:

The economic calendar’s highly anticipated event, the Federal Reserve’s rate decision and outlook, is looming on the horizon with markets pricing in potential contractionary effects. Consumer sentiment statistics reported a drop yesterday from the 103 level towards 97, highlighting a drop in overall financial confidence.
With bearish anticipations on the horizon, the demand outlook on WTI Crude Oil is in question, weighing down on oil prices. Another factor in the play is the crude oil inventory data later today, with higher expectations for supply levels between last week’s -6.4M change and this week’s -2.3M change.
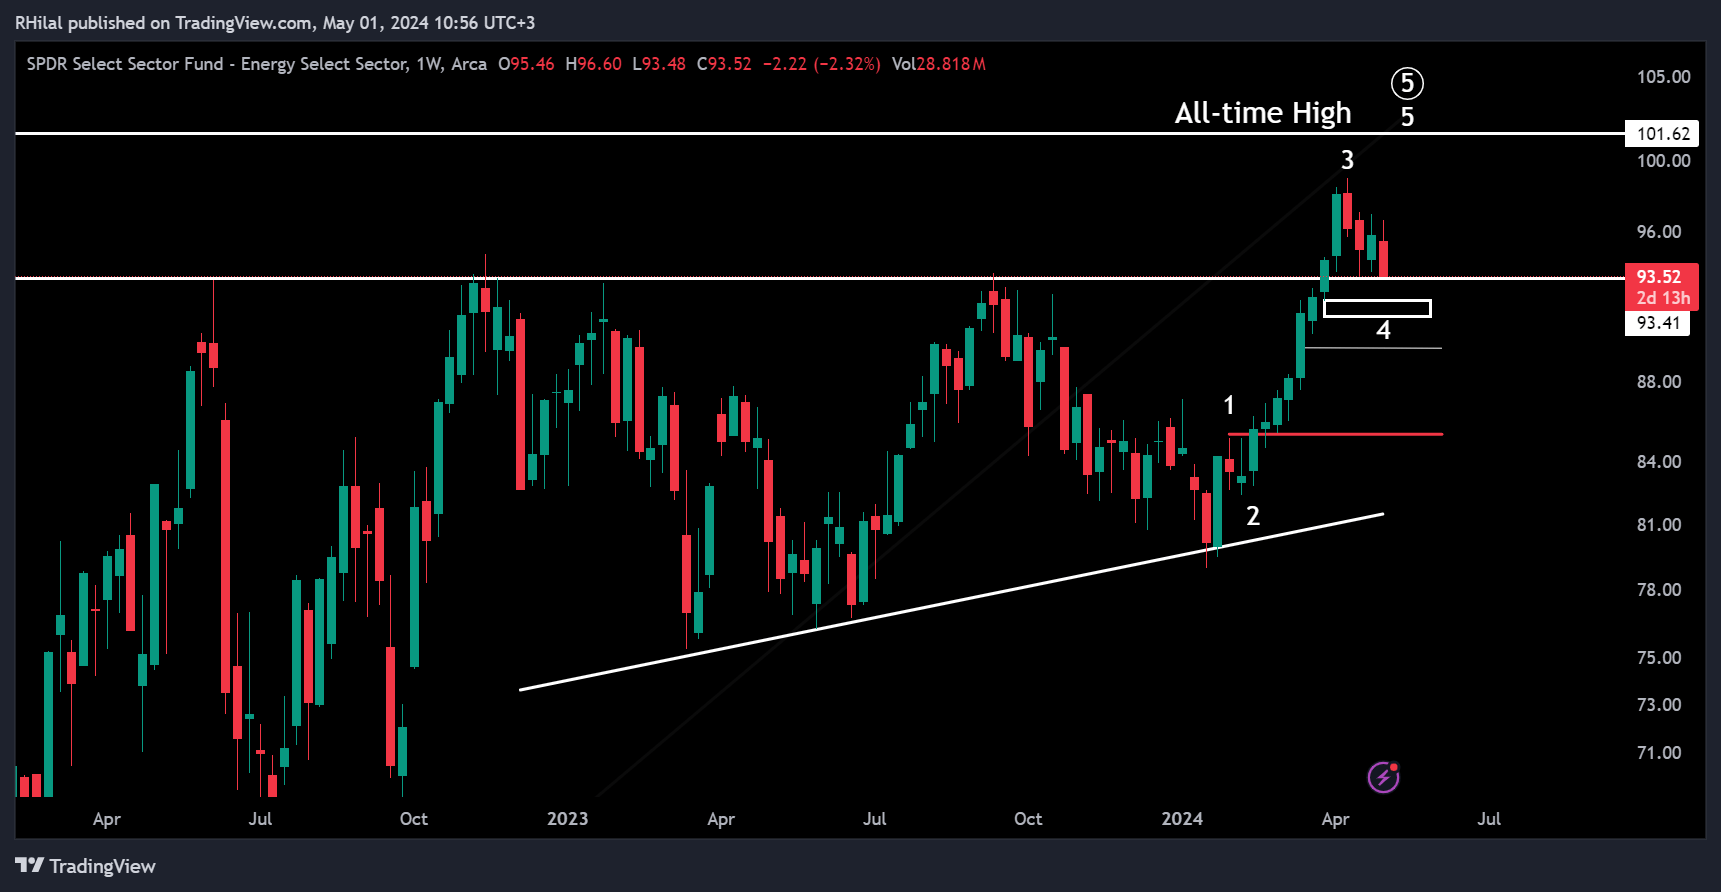
SPDR Energy Select Sector (XLE) – Weekly Timeframe – Logarithmic Scale
The Energy Select Sector ETF (XLE) is back at a significant support zone, that served as a 1.3-year resistance prior to this year’s breakout. A drop back in the extended consolidation can stimulate bearish sentiment from a pattern perspective. However, from an Elliott wave perspective, prices can still potentially hold near the previous wave’s 4 zone, between 92.20 and 92.60, prior to the continuation of the year’s trend back up to the chart’s all-time high.
WTI Crude Oil – Daily Time Frame – Logarithmic Scale
Tracing a positive correlation with the SPDR Energy Select ETF (XLE), WTI Crude Oil touched back down the 80 zone with the latest 80.29 low. From an Elliott wave perspective, it retested near the lower degree wave 4 and can potentially hold a support level prior to the continuation of this year’s uptrend, given supporting fundamentals from positive economic outlooks and decreasing supply levels. The break below the 80-price zone can pave the way to the next significant Elliott wave level, the high of the trend’s wave 1, near the 78.60 zone. From a relative strength index perspective, the chart’s momentum dropped to weaker/oversold territories, potentially signaling an upcoming reversal.
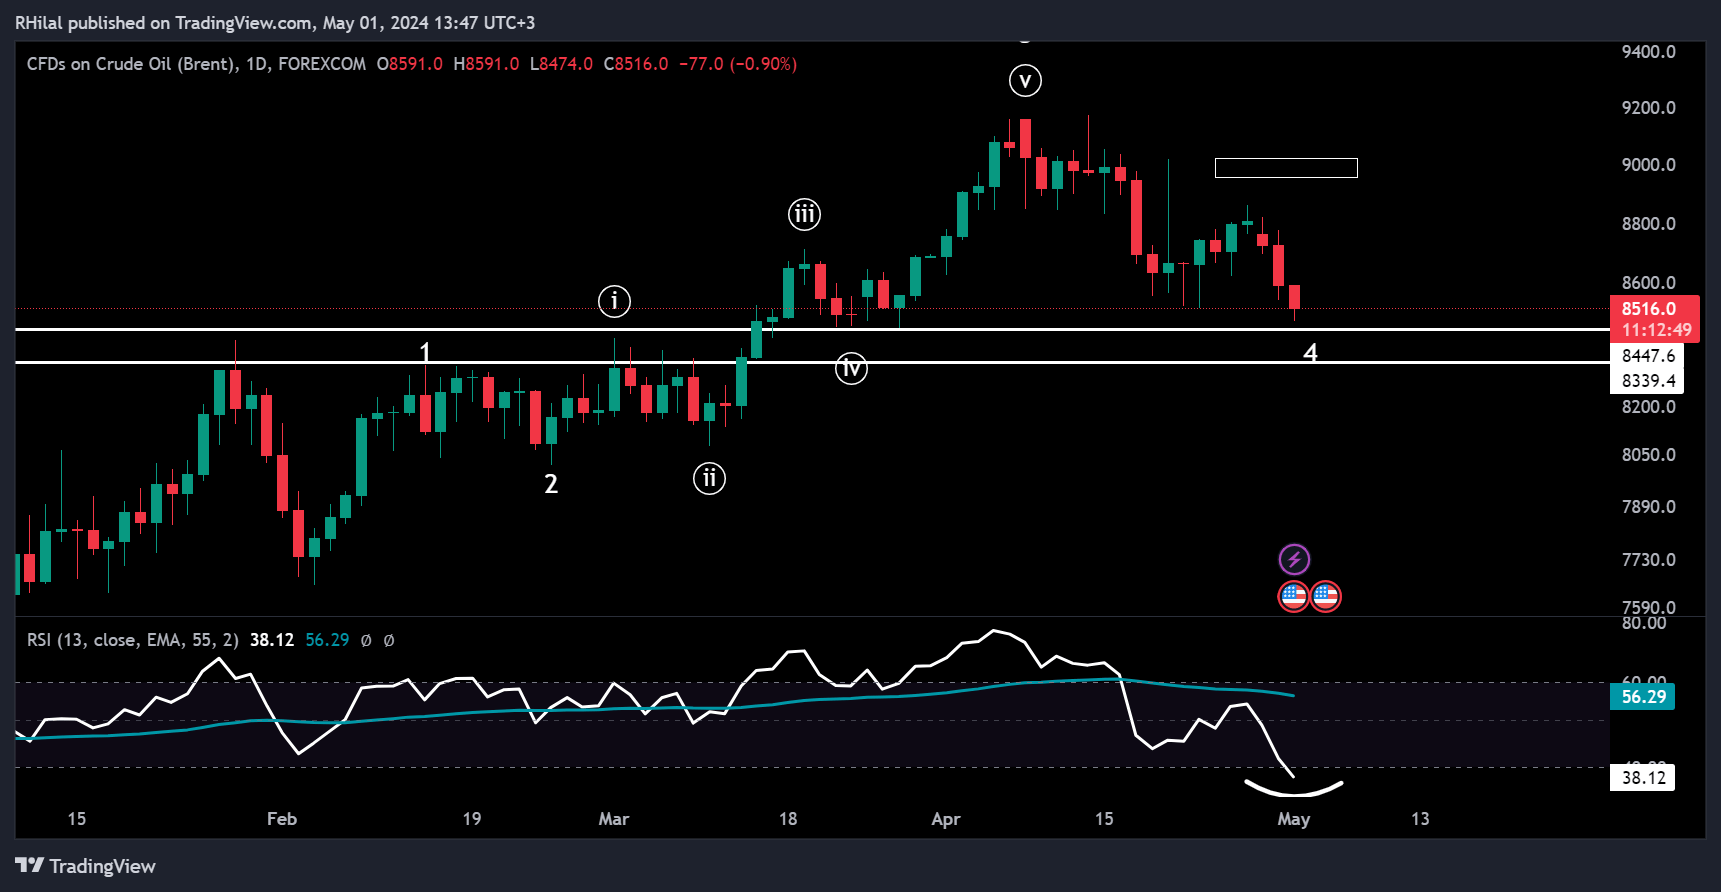
UKOIL – Daily Time Frame – Logarithmic Scale
UKOIL, also tracing positive correlations with the previously mentioned charts, tested a significant 84.74 low. A deeper correction can trace towards the trend’s wave 1 highs, near the 83.30-82.60 zone. From a relative strength index perspective, the chart’s momentum dropped to weaker/oversold territories, potentially signaling an upcoming reversal.
With technical scenarios set up, market sentiment and priced-in policies are closely monitored, anticipating heightened volatility as the day progresses.
Related tags:


Open an account in minutes
Experience award-winning platforms with fast and secure execution, and enjoy tight spreads from 0.5 pts on FX and 0.3 pts on indices.
Economic calendar
Web Trader platform
Our sophisticated web-based platform is packed with features.
Related articles

Nikkei breakout accelerates as yen weakness returns
Nikkei has started October with a powerful breakout, helped by renewed yen weakness and strong upside momentum


AUD/USD hammered by US yields and fading RBA hike bets
US yields, dollar strength and fading RBA hike bets have combined to drive AUD/USD to fresh multi-month lows. The macro and technical bias remains bearish, although history suggests parts of the move are now reaching unusually stretched levels.

Canadian Dollar Forecast: USD/CAD Four-Week Rally Eyes Yearly Highs 9 30 2026
USD/CAD has advanced in 14 of the past 15 sessions, but stretched momentum raises the stakes as major resistance and NFP come into focus.

This report is intended for general circulation only. It should not be construed as a recommendation, or an offer (or solicitation of an offer) to buy or sell any financial products. The information provided does not take into account your specific investment objectives, financial situation or particular needs. Before you act on any recommendation that may be contained in this report, independent advice ought to be sought from a financial adviser regarding the suitability of the investment product, taking into account your specific investment objectives, financial situation or particular needs.
StoneX Financial Pte. Ltd., may distribute reports produced by its respective foreign entities or affiliates within the StoneX group of companies or third parties pursuant to an arrangement under Regulation 32C of the Financial Advisers Regulations. Where the report is distributed to a person in Singapore who is not an accredited investor, expert investor or an institutional investor (as defined in the Securities Futures Act), StoneX Financial Pte. Ltd. accepts legal responsibility to such persons for the contents of the report only to the extent required by law. Singapore recipients should contact StoneX Financial Pte. Ltd. at 6826 9988 for matters arising from, or in connection with the report.
In the case of all other recipients of this report, to the extent permitted by applicable laws and regulations neither StoneX Financial Pte. Ltd. nor its associated companies will be responsible or liable for any loss or damage incurred arising out of, or in connection with, any use of the information contained in this report and all such liability is hereby expressly disclaimed. No representation or warranty is made, express or implied, that the content of this report is complete or accurate.
StoneX Financial Pte. Ltd. is not under any obligation to update this report.
Trading CFDs carries a high level of risk that may not be suitable for some investors. Consider your investment objectives, level of experience, financial resources, risk appetite and other relevant circumstances carefully. The possibility exists that you could lose some or all of your investments, including your initial deposits. If in doubt, please seek independent expert advice. Visit www.forex.com/en-sg/terms-and-policies for the complete Risk Disclosure Statement.