
Key Events
- Market fear pushed Bitcoin expectations toward 50,000, yet the 80,000 support and Santa rally narrative are holding the ground ahead of the FOMC outcome.
- Nasdaq redirected gains back toward the 25,800 mark, a level that could confirm another surge to record highs above 26,300, or signal extended consolidation depending on the upcoming FOMC tone and ongoing concerns around tech sector overvaluation.
Bitcoin Outlook: 2 Week Time Frame – Log Scale
 Source: Trading view
Bitcoin is currently trading below the trendline connecting consecutive higher lows since November 2022, indicating a bearish bias unless price regains this barrier and the 110,000 resistance.
A close above 110,000 would re-establish bullish momentum, opening the door toward the all-time record at 126,000, followed by new potential records near 137,000, 150,000, and 190,000–200,000, in alignment with the trendline connecting higher highs from March 2024 to December 2024.
On the downside, a drop below 80,000 is expected to extend losses toward 70,000, and in more extreme cases, a drop below 70,000 could expose the 50,000-region. (Previous support zone between March and September 2024)
Nasdaq Outlook: Daily Time Frame – Log Scale
 Source: Trading view
On the daily time frame, Nasdaq is hovering just below 25,800 resistance — the final barrier before retesting the 26,300 record high. A breakout above that level could unlock upside targets of 27,000 and 27,700.
However:
- If prices fail to hold and bearish sentiment emerges, a drop back below 25,200 is expected to extend declines toward 24,800, 24,400, and 23,900.
- The 23,900 level also acts as a potential double top neckline if prices pull back again from the 26,000 zone. A clean break below 23,900 would confirm a double-top formation, targeting 23,500 and 22,900.
These levels are derived using the Fibonacci extension tool based on the 2025 peak, the 23,900 low, and the 25,800 high.
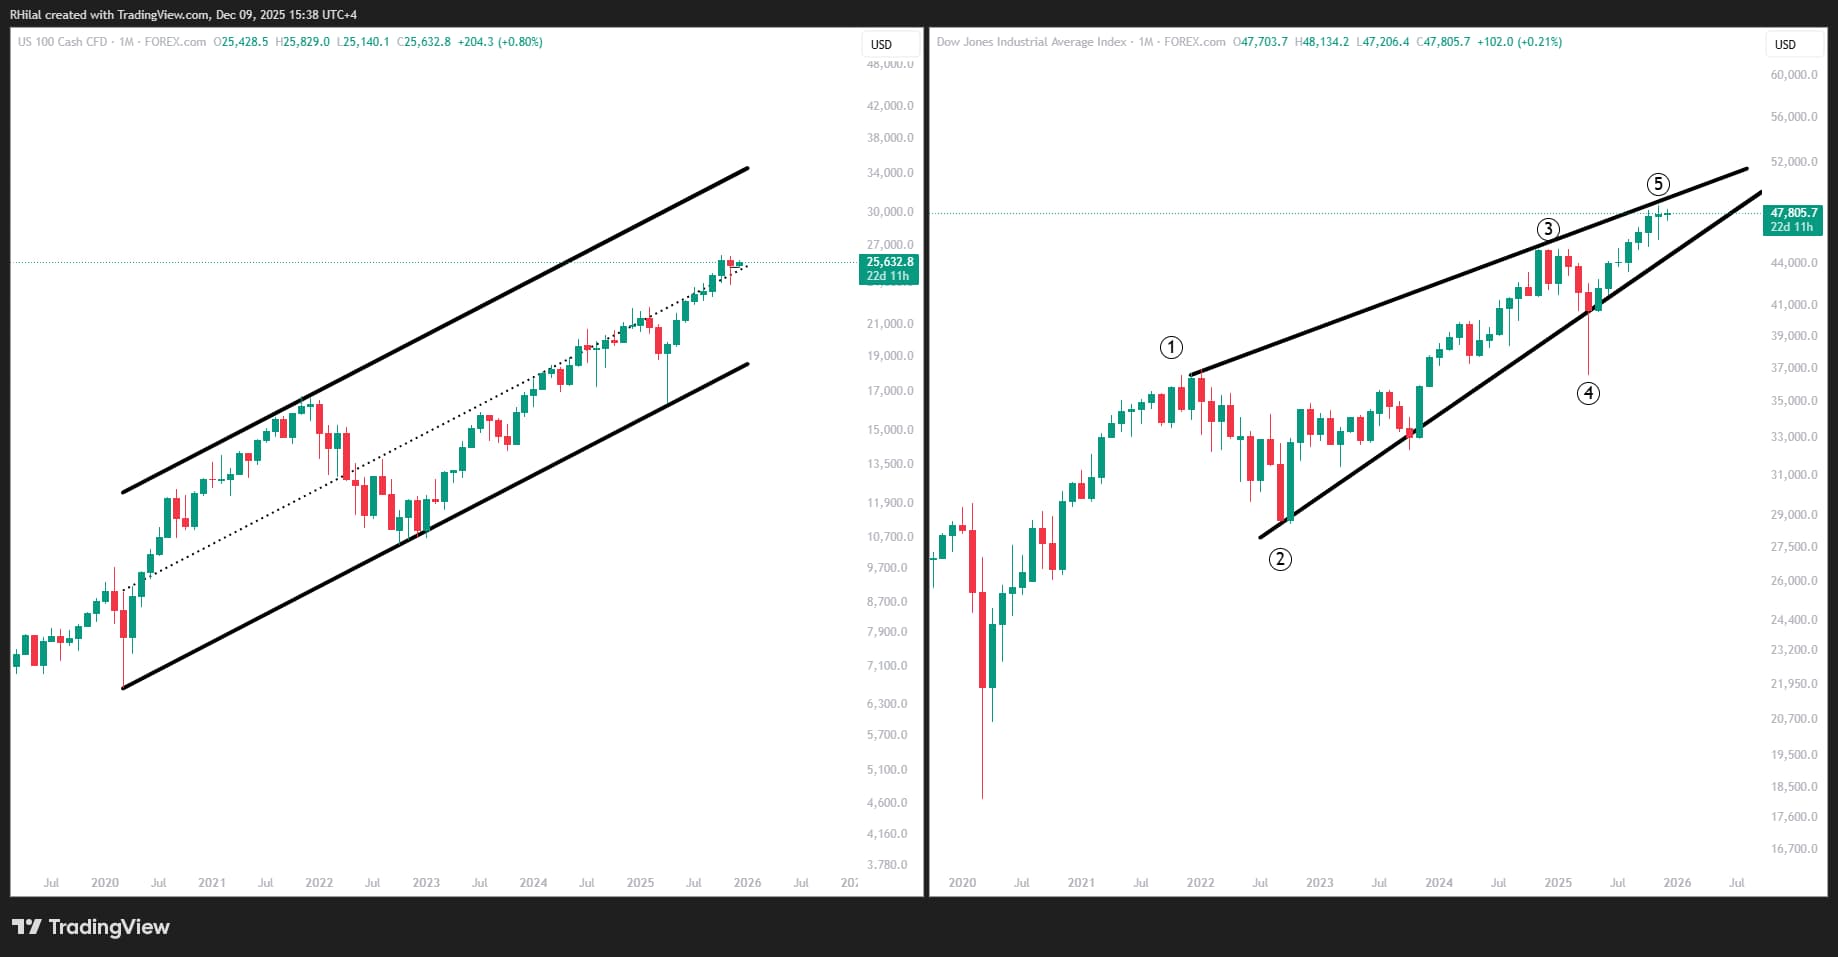
While individual charts suggest consolidation risks, the divergence between gold and silver, alongside the contracting price action in the Dow Jones since 2020, adds caution regarding further highs until clear confirmations emerge.
Nasdaq, Dow Outlook – Monthly Time Frame – Log Scale
Source: Trading view
From 2020 to 2025, Nasdaq has maintained a persistent bullish bias within the bounds of a rising parallel channel. In contrast, the Dow Jones shows a contracting structure extending from 2020, raising pullback risks below the 49,000 zone while Nasdaq challenges the 26,000 and mid zone region.
Should the Dow break out of this contracting formation, the broader bullish bias is expected to continue.
Another notable divergence this December is the notable lag between Gold and Silver.
Gold, Silver Outlook - Monthly Time Frame – Log Scale

Source: Trading view
Gold’s price action continues to consolidate, while silver holds below the key psychological level at 60. With gold appearing muted and silver showing overheated momentum — and considering their usual positive correlation with indices — expectations of further pullbacks or consolidations persist until a clear hold above the 2025 records emerges.
Such a breakout would likely shape the 2026 outlook for the markets
Written by Razan Hilal, CMT
Follow on X: @Rh_waves