
GBP/USD, British Pound Talking Points:
- GBP/USD has been a favored pair for USD-weakness of late, highlighted in webinars over the past few weeks.
- Last week saw a significant inflection point across the Dollar, as a post-CPI rally found sellers and that was echoed cleanly in GBP/USD.
- Cable has now set a fresh monthly high and with the US Dollar finishing last week with a bearish engulf, the pair remains one of the more attractive venues to look for a deeper turn in DXY.
Last week could have went far differently. A stronger-than-expected CPI print out of the US on Wednesday was followed by a stronger-than-expected PPI print a day later. And while the forces of inflation remain strong in the US, there’s the expectation that the Fed will have little choice but to hike again this year; and perhaps hike two more times in the two remaining meetings, although odds for that have backed down a bit.
And as those odds pared back, so too has USD-strength, following the currencies breakout to a fresh yearly high last week on the heels of that CPI release. But perhaps more interesting is the big picture, as the weekly bar closed as a bearish engulf with even more weakness on the PPI report released on Thursday morning.
In GBP/USD, that theme showed well, with the Wednesday shot of USD-strength showing as a fresh low in GBP/USD, with support coming in at a familiar spot of 1.3145. This is the 38.2% Fibonacci retracement of the 2025 rally and that was where bears relented and buyers took over. That continued in the day after, with last Thursday’s candle building as a bullish engulf, and that strength has built in the days since.
GBP/USD Daily Chart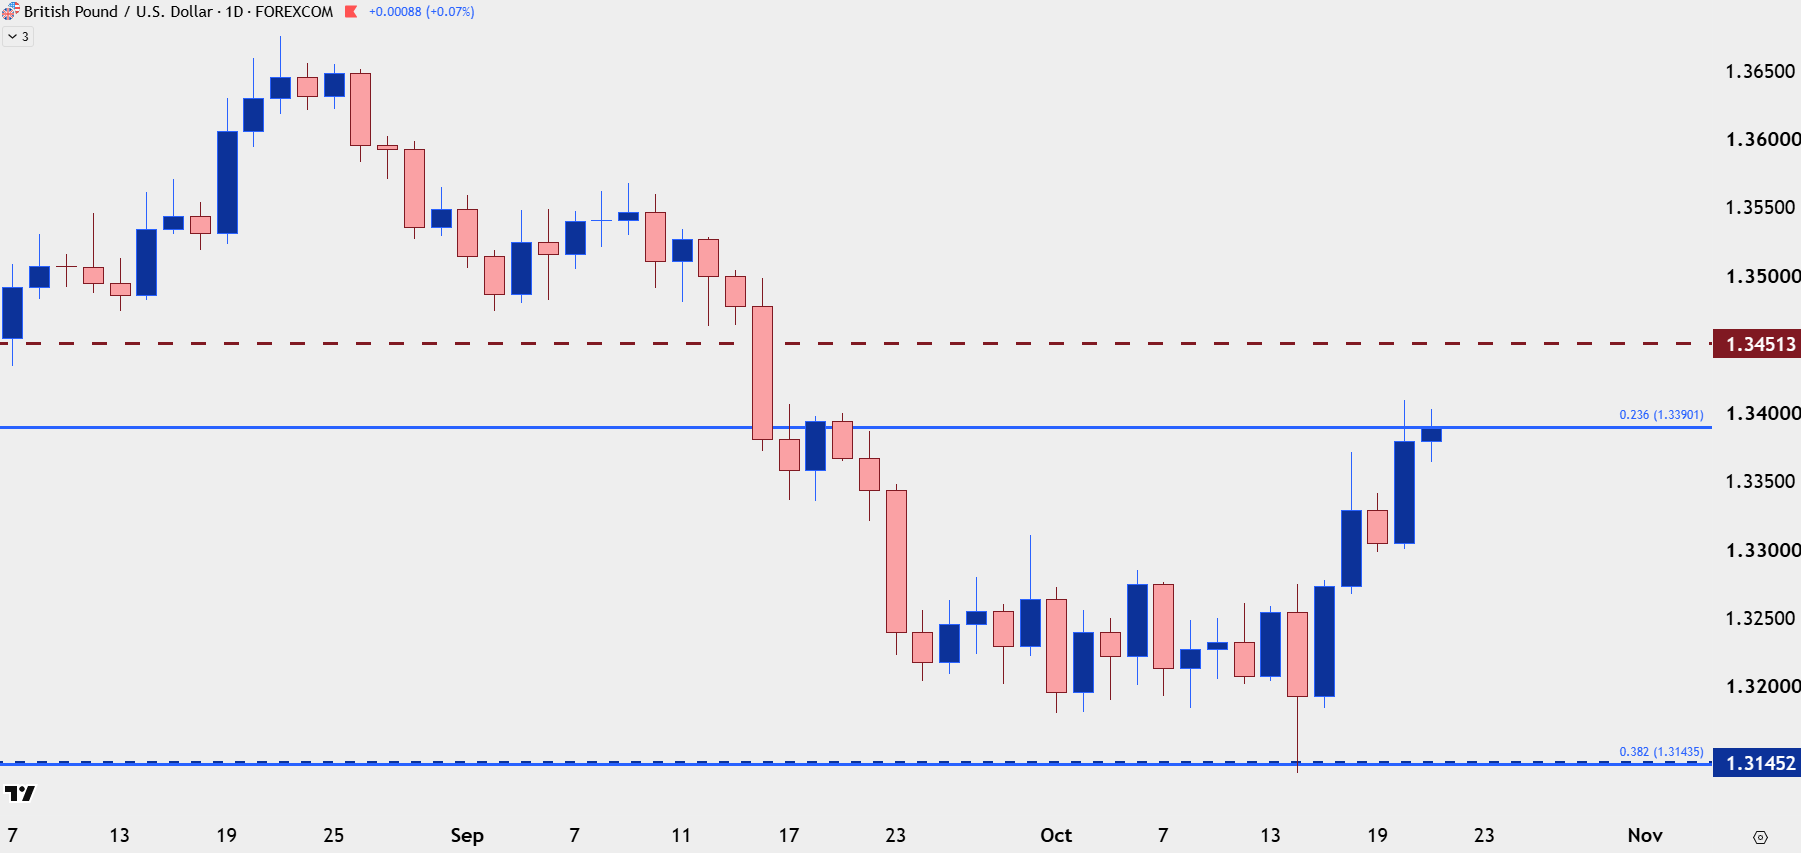
Chart prepared by James Stanley; data derived from Tradingview
GBP/USD with Perspective
From the weekly chart the year of 2026 has been a very clean range, with resistance just below the 1.3700 level ands support around the same 1.3145 Fibonacci level up to around 1.3200. Last week printed as a bullish engulf, which mirrors the bearish engulf in the USD quite nicely, and this points to the fact that the pair is still one of the more attractive areas to look for a continuation of USD-weakness.
GBP/USD Weekly Chart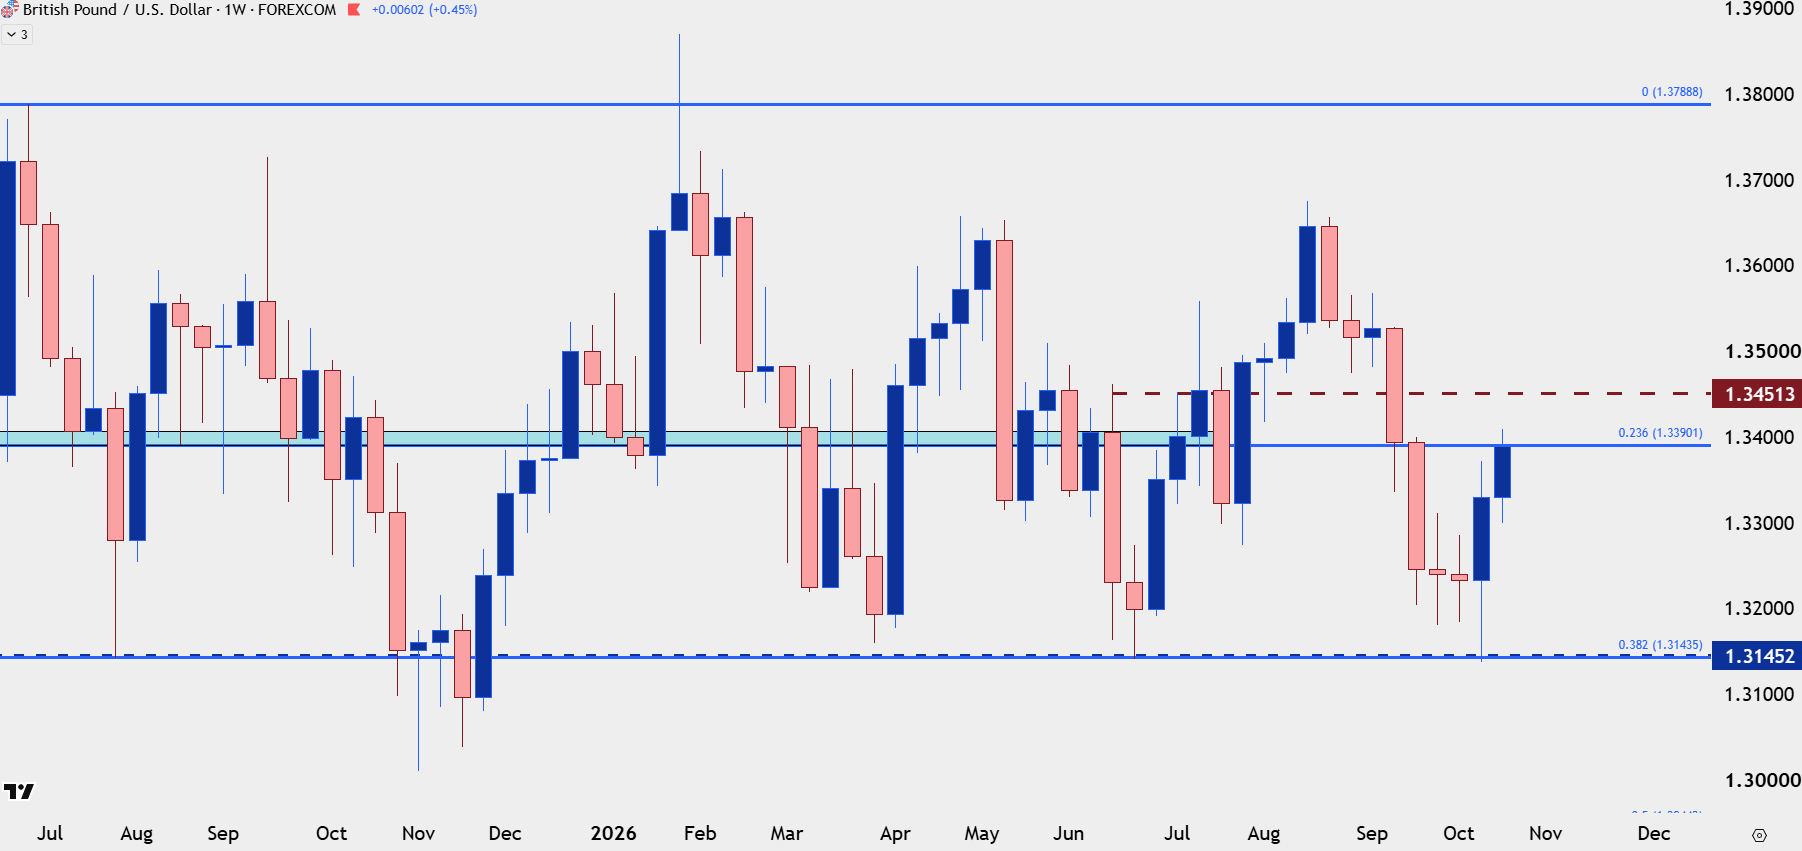
Chart prepared by James Stanley; data derived from Tradingview
GBP/USD Shorter-Term Structure
From the four-hour chart, the trend has been consistent and price is currently trying to break through the 23.6% retracement of the same Fibonacci setup from which the 38.2 set the low last week. This also highlights a key point of resistance overhead, at the 1.3475 level.
But for higher-low support, there’s two spots that stand out, with the prior swing at 1.3337 followed by a zone from 1.3275-1.3300. A show of buying support in each keeps the door open for bullish trend scenarios.
GBP/USD Four-Hour Price Chart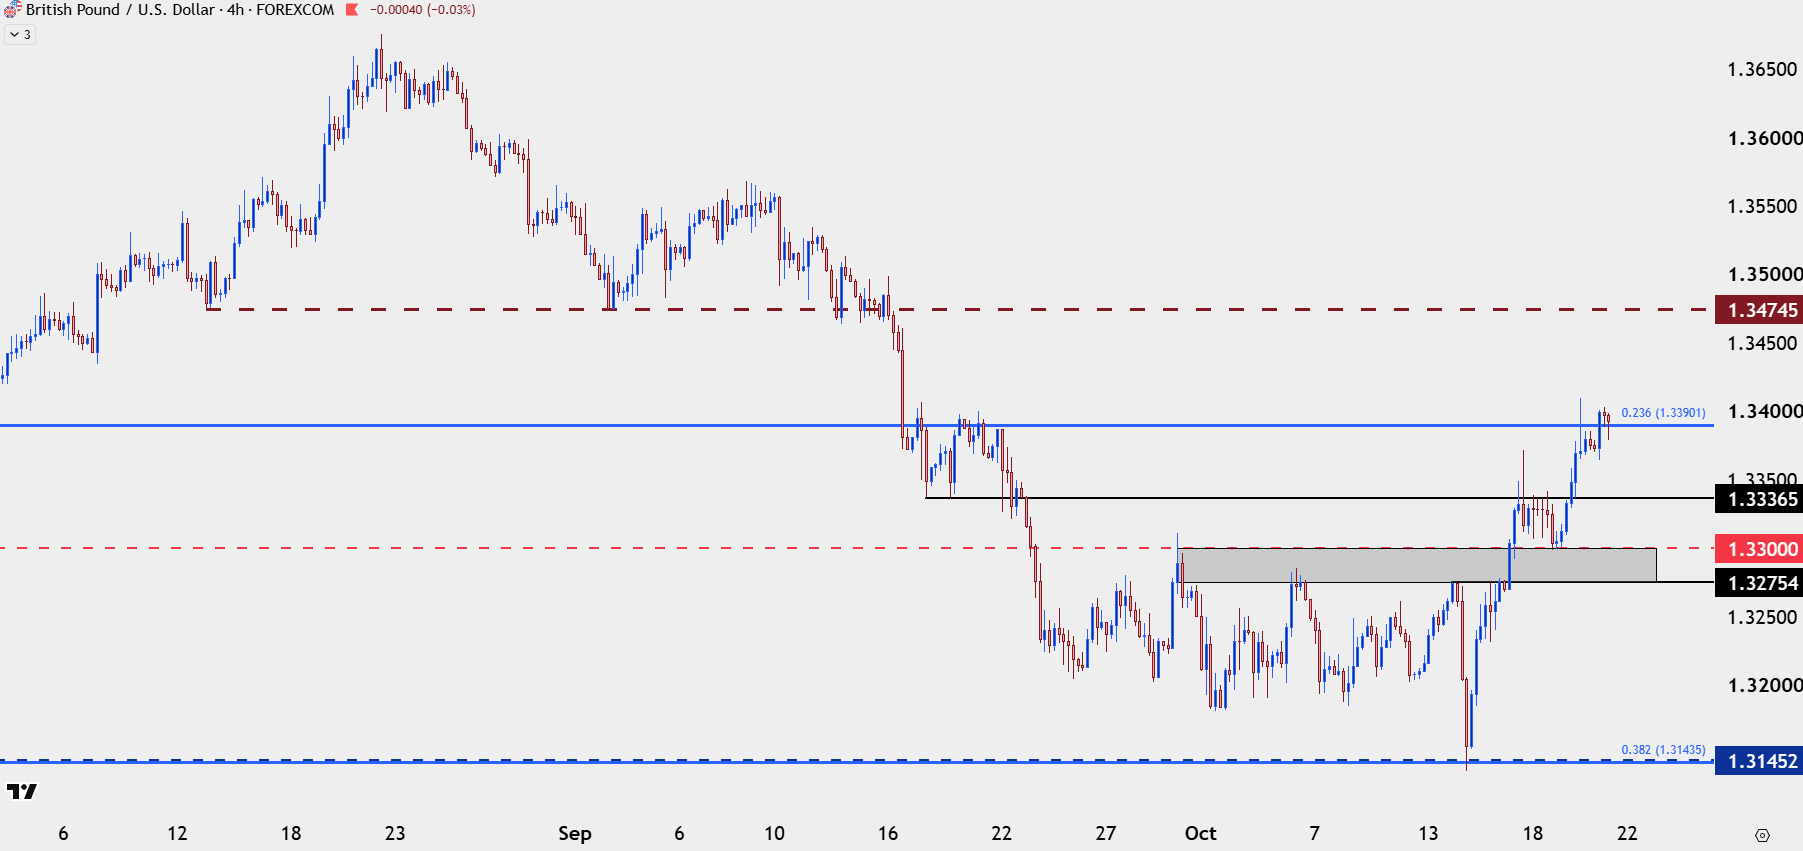
Chart prepared by James Stanley; data derived from Tradingview
--- written by James Stanley, Senior Market Analyst, Global Macro