
The British Pound was in a dire state just two weeks ago, with GBP/USD sinking towards the 1.3000 level while the daily chart showed its most oversold reading for the pair in more than two years. But now, the prospect of recovery looms large in both GBP/USD and GBP/JPY.
British Pound Technical Analysis
Just two weeks ago GBP/USD was leading the way lower for major FX pairs as the US Dollar threatened a breakout at fresh four-month highs. But as looked at in the webinar at the time the pair was flashing deep oversold conditions, with RSI on the daily chart pushing down to the 23-level while flirting with a test of the psychological level at 1.3000. As shared then, that made for a difficult backdrop for sellers, even if there was a fundamental drive behind the move. At the very least, bears could wait for a pullback to see if a cleaner entry availed itself, at which point the 1.3000 test could serve as a target of sorts, while also allowing that deep oversold condition to rectify.
Well, last week brought the pullback and now seller have that open door to push if they choose. So far, however, bulls have done a decent job of supporting the move by showing support at a familiar level of 1.3100 and prodding a bounce back up towards the 1.3200 level.
GBP/USD Four-Hour Price Chart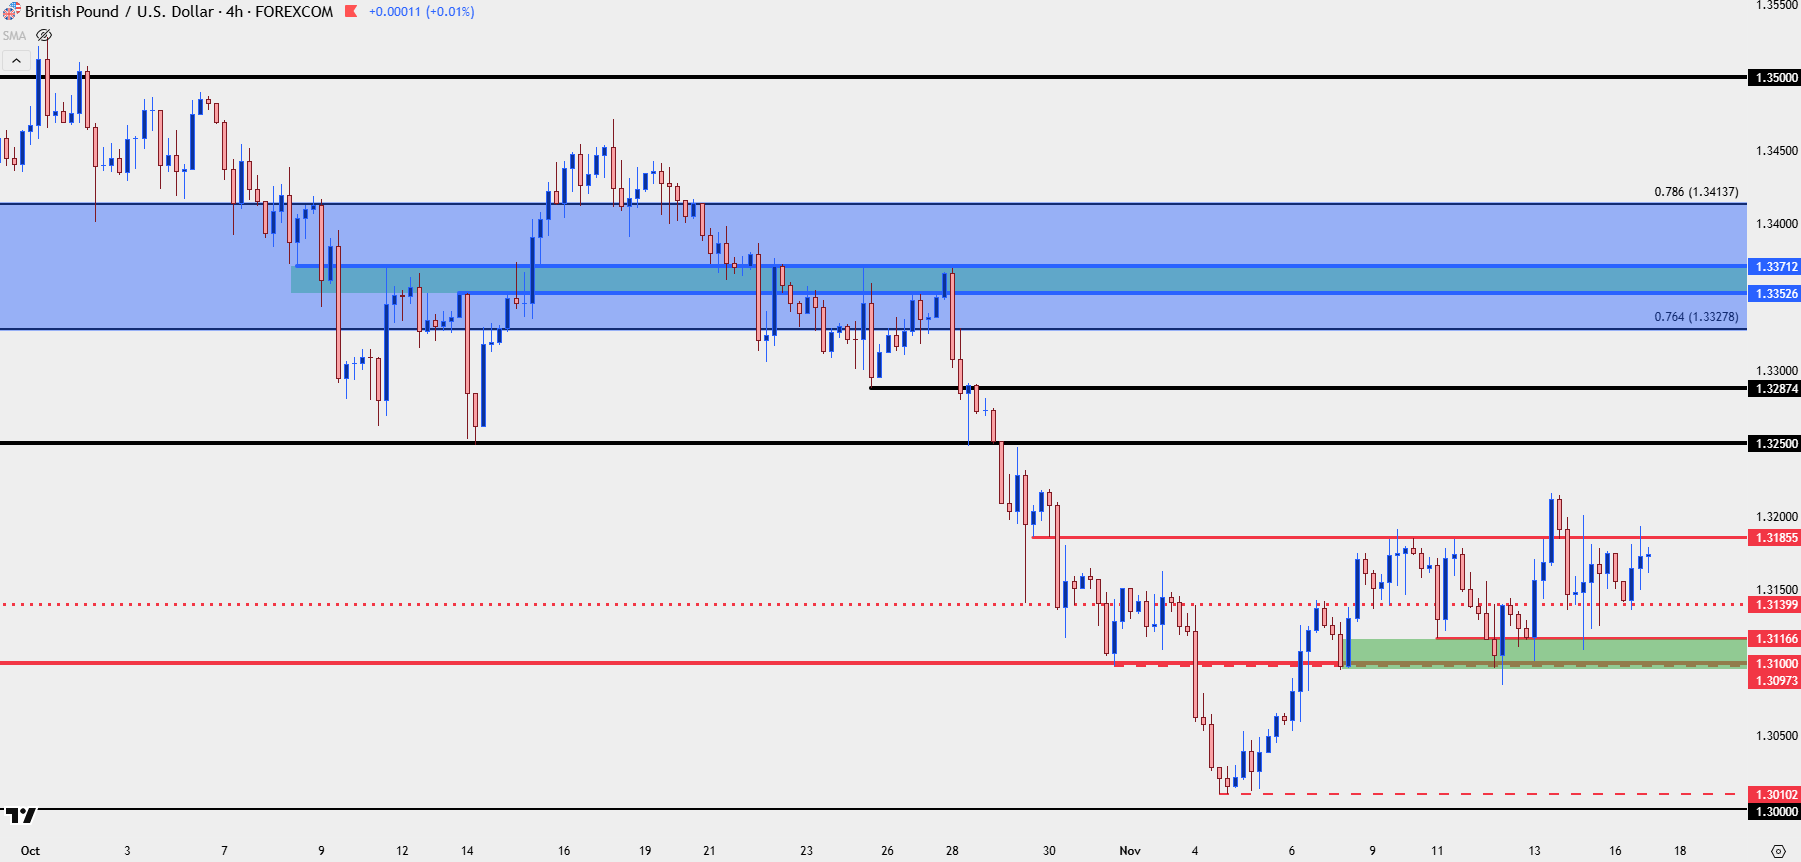
Chart prepared by James Stanley; data derived from Tradingview

GBP/USD
The daily chart of GBP/USD still shows what could turn out to be a reversal setup given that support hold in the final three days of last week around the 1.3100 level. I looked at that in the weekend video and article on USD and since then buyers have continued to hold the line. The next significant area of resistance potential is the 1.3250 psychological level that rests just over near-term highs.
GBP/USD Daily Chart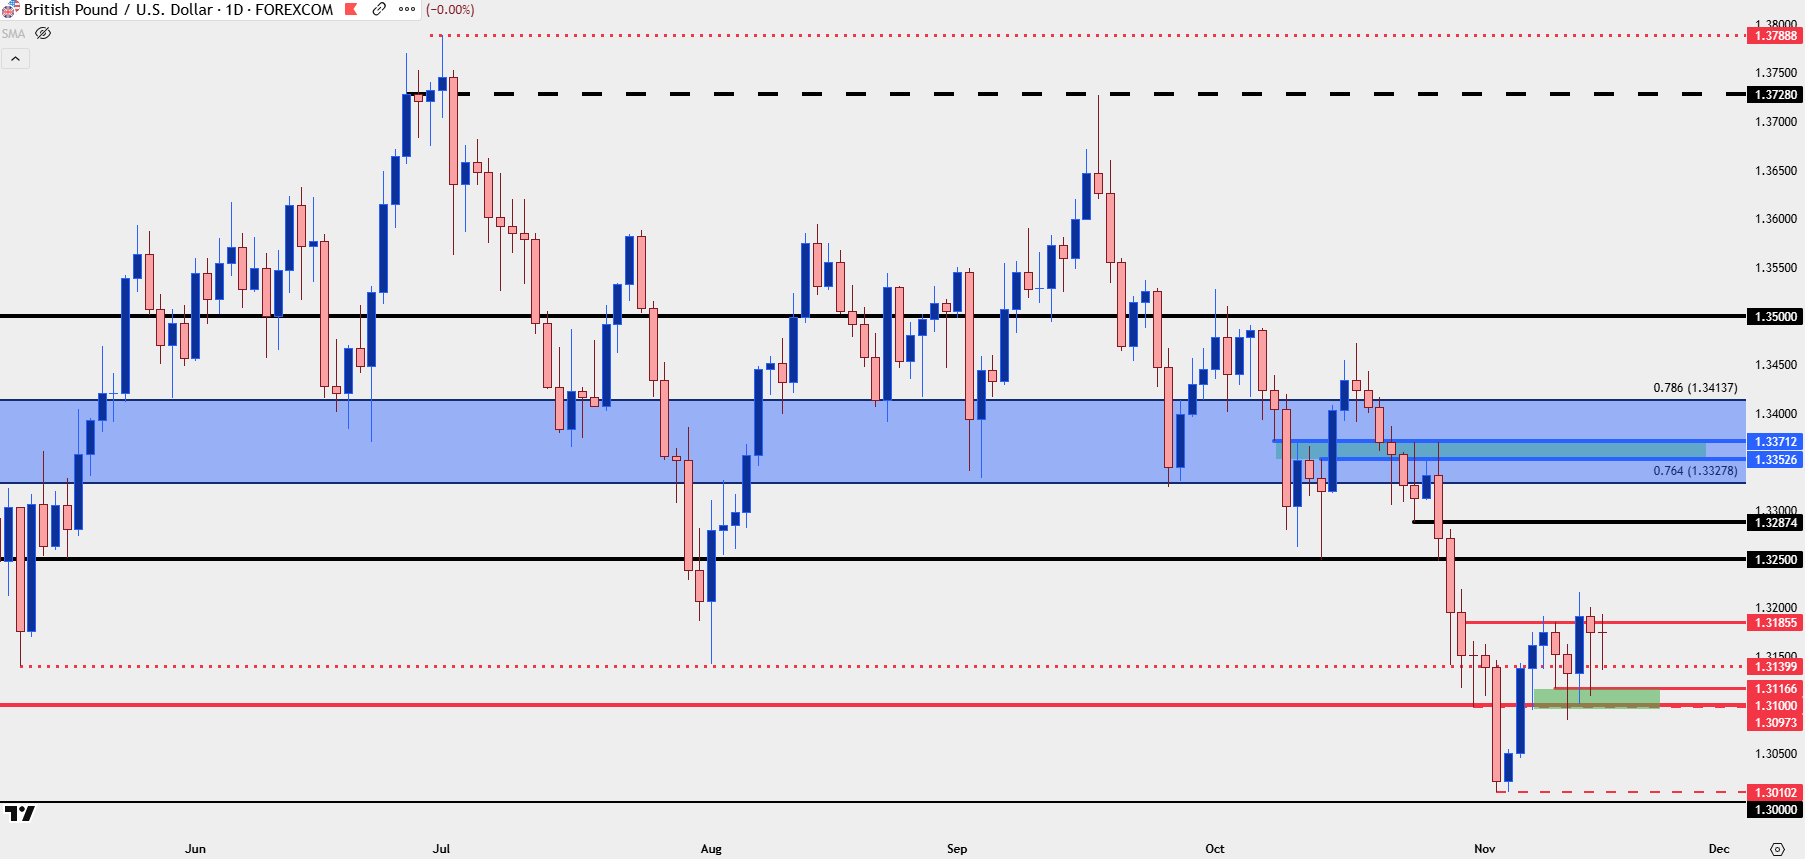
Chart prepared by James Stanley; data derived from Tradingview
GBP/USD Weekly
There’s another point of reference and this is a price level that’s helping to hold the daily low so far. The 38.2% Fibonacci retracement of the 2025 up-trend plots at 1.3146 and that level was tested for each of the past three weeks. But, perhaps more importantly, that level has held the weekly close – illustrating a degree of defense from buyers and evidence of rejection for bears.
This keeps the door open for bounces in GBP/USD but as I’ve been talking about in USD-related items, there may be a more amenable pasture for British Pound strength elsewhere, such as against the Japanese Yen.
GBP/USD Weekly Chart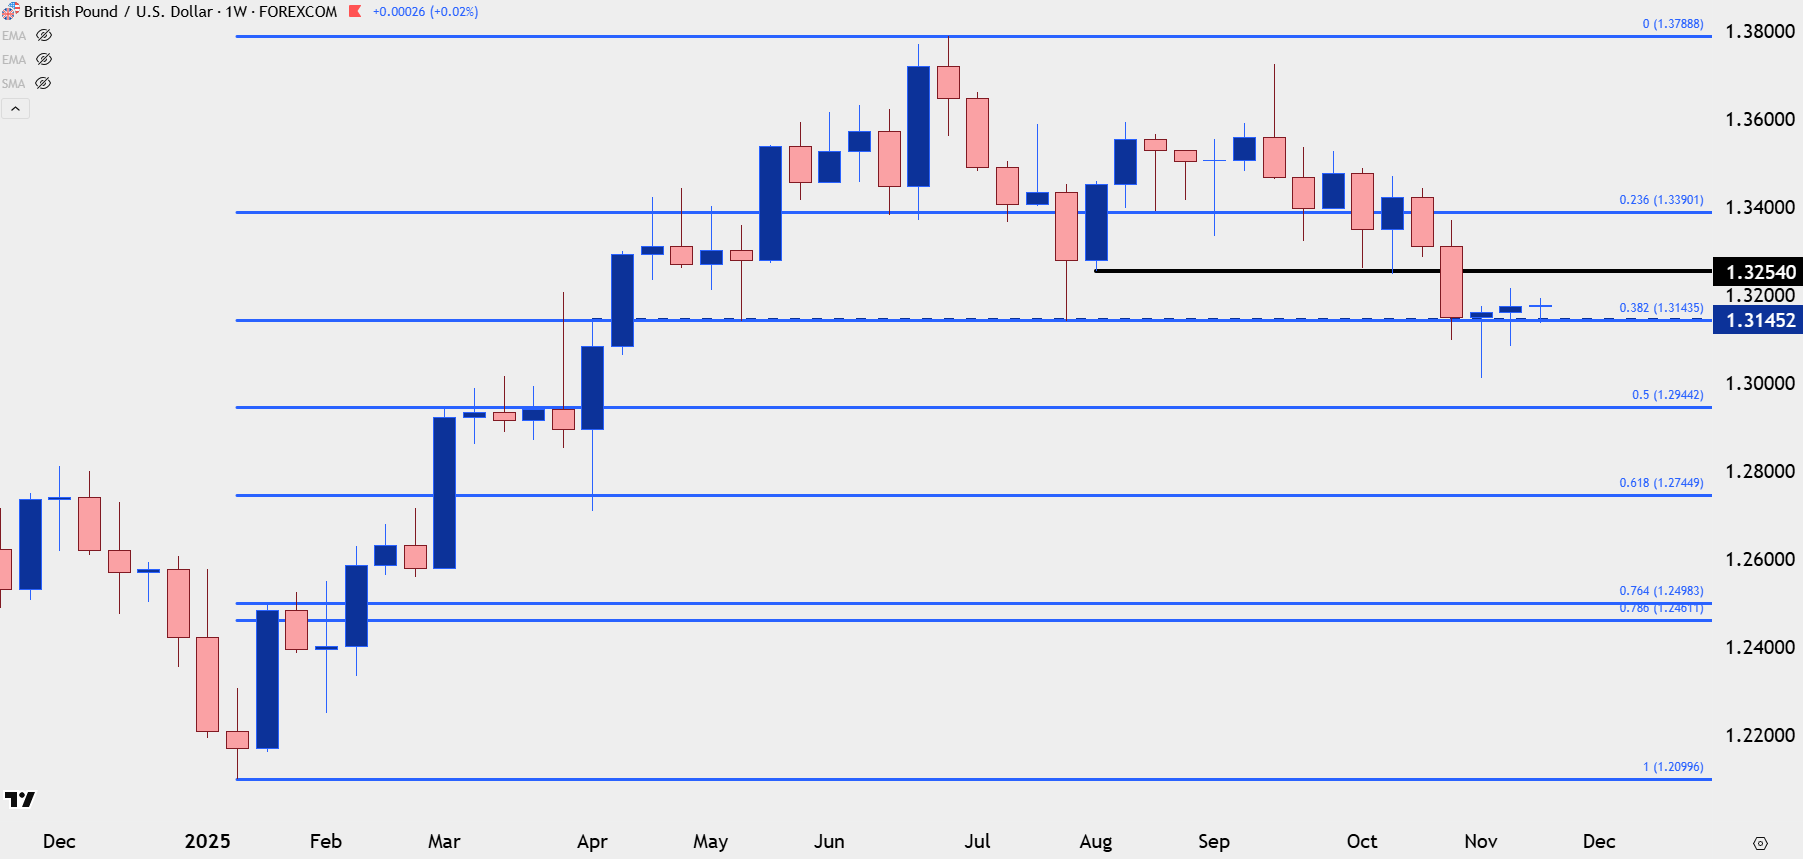
Chart prepared by James Stanley; data derived from Tradingview
GBP/JPY
As GBP/USD struggles to dig itself out of the pullback on the weekly chart, GBP/JPY has already set a fresh monthly high. And given the rally in USD/JPY this makes sense as traders have essentially been able to push against a weaker Japanese Yen.
I looked into the setup in GBP/JPY last week, and at the time a breakout was coiling in the pair around the 203 handle. That breakout has since cleared to the initial target, pulled back and found higher-low support off of prior resistance, and then broken out again.
There’s now support potential at that prior resistance target of 204 and the next topside level of note is 205 and 205.33, which is the current yearly high for the pair.
GBP/JPY Four-Hour Chart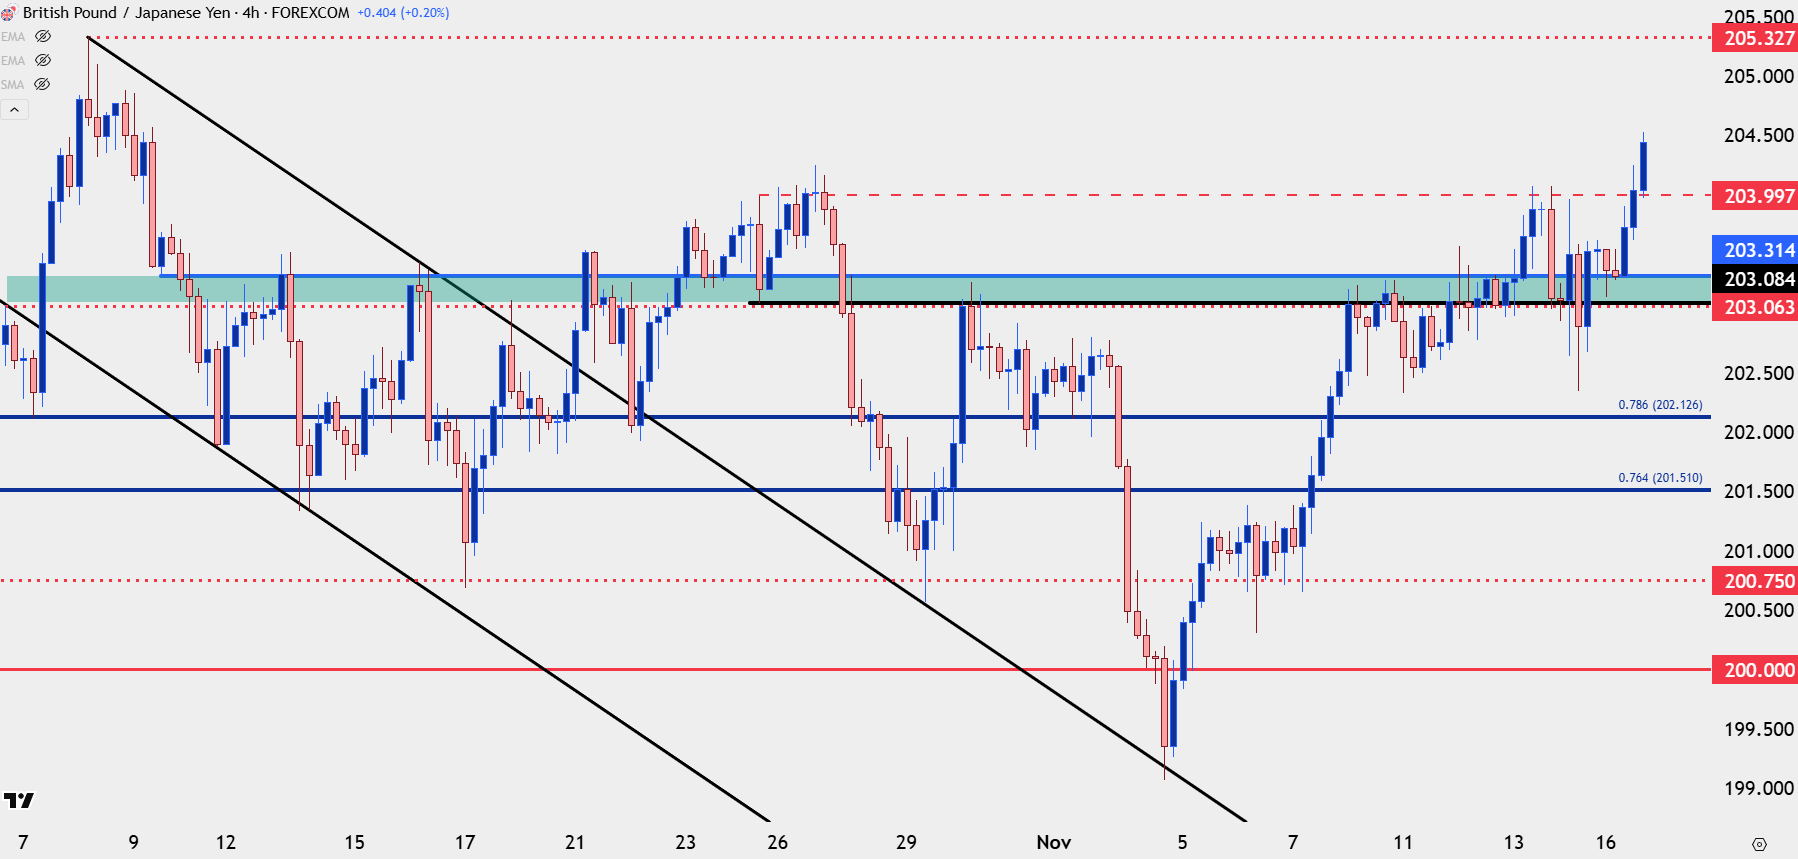
Chart prepared by James Stanley; data derived from Tradingview
EUR/GBP
If looking to fade GBP-strength themes, marrying the currency up against a recent strong performer could be a desired pathway. The Euro has been one of the strongest currencies on a relative basis of late and as such, EUR/GBP is trading at fresh two-month highs.
So, to put this into a logic statement, GBP-strength is at fresh highs against the Yen but GBP-weakness is at fresh lows against the Euro; which means a couple of things. First EUR/JPY could be an attractive backdrop for both Euro strength and Yen weakness, while EUR/GBP could be a way to harness that Euro strength against a potentially weak GBP, if the trader did want to push that scenario.
From the weekly chart of the pair there’s a couple of items that stand out. First is the prior resistance around .8750 that held through three separate episodes, until the breakout a few weeks ago. That horizontal resistance, when coupled with the higher-lows and bullish trendline, made for an ascending triangle formation, which further puts emphasis on .8750 as a spot of higher-low support potential in the event that a pullback shows in the near-term setup.
EUR/GBP Weekly Chart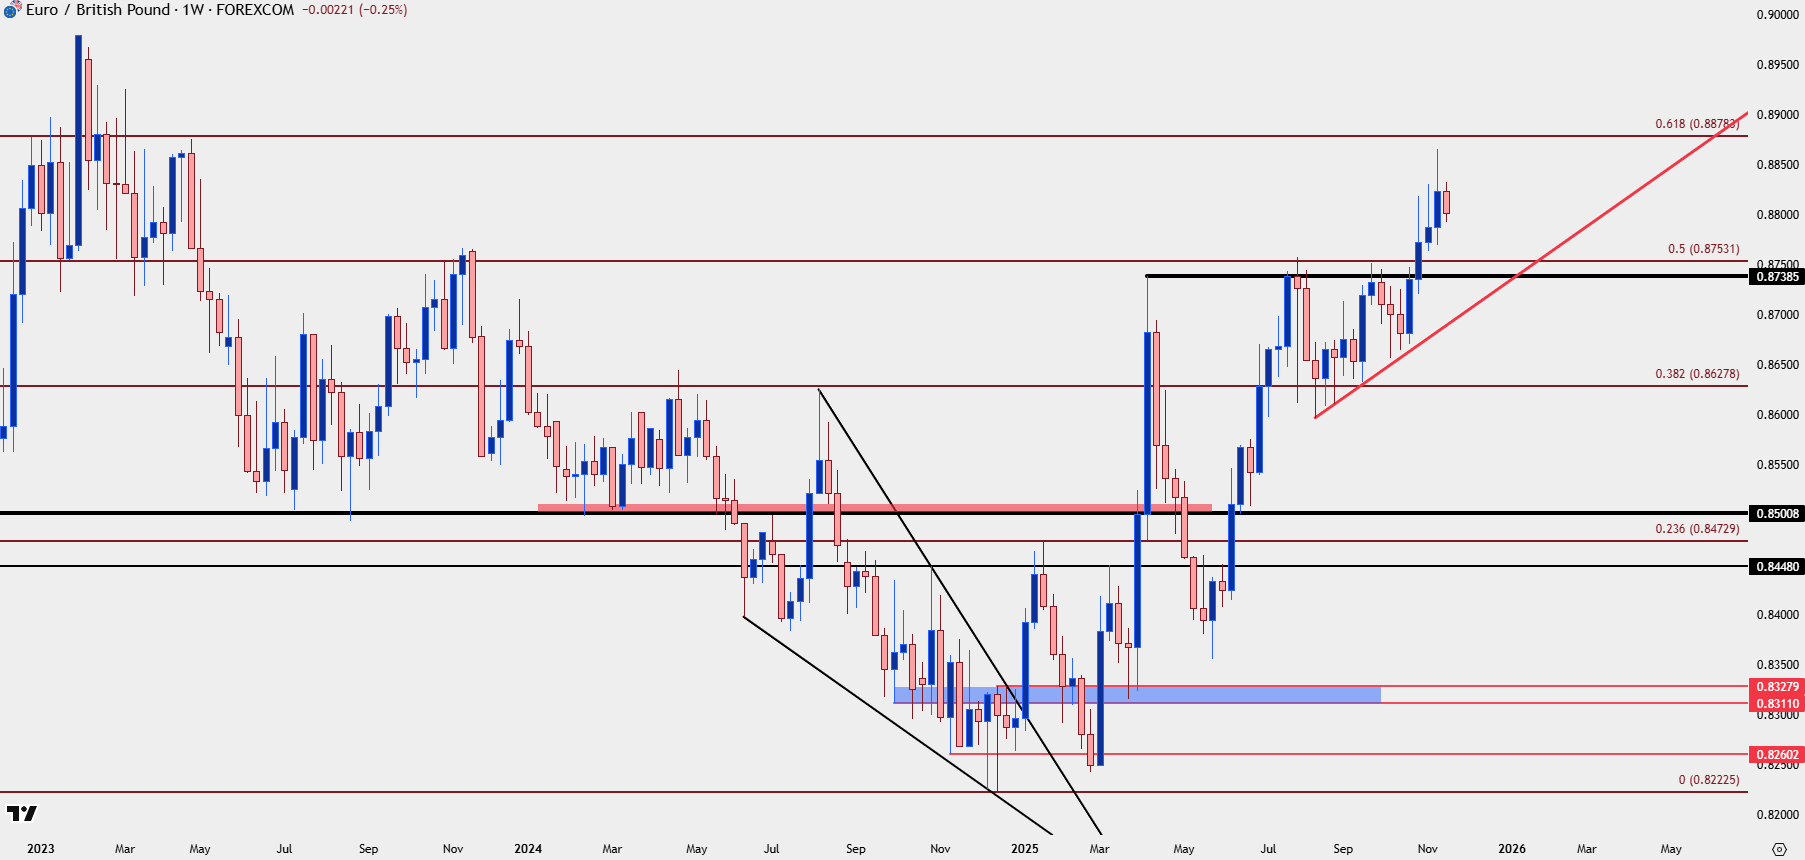
Chart prepared by James Stanley; data derived from Tradingview
EUR/GBP
From the daily chart we can see last Friday’s upper wick as a harsh rejection of the .8850 level, and that candle completed as an inverted hammer formation which points to the possibility of deeper pullback. We’ve already seen a test of the .8800 handle but there’s no evidence yet that the price will be able to hold the pullback from last week’s highs, so there’s a couple of ways to approach the pair at the moment.
For aggressive stances, looking for a daily close above the .8800 big figure could keep the door open for longs, looking for re-test of .8850. Or, alternatively, a deeper pullback puts the focus on that .8750 area of prior resistance as a spot of key support in the pair.
EUR/GBP Daily Chart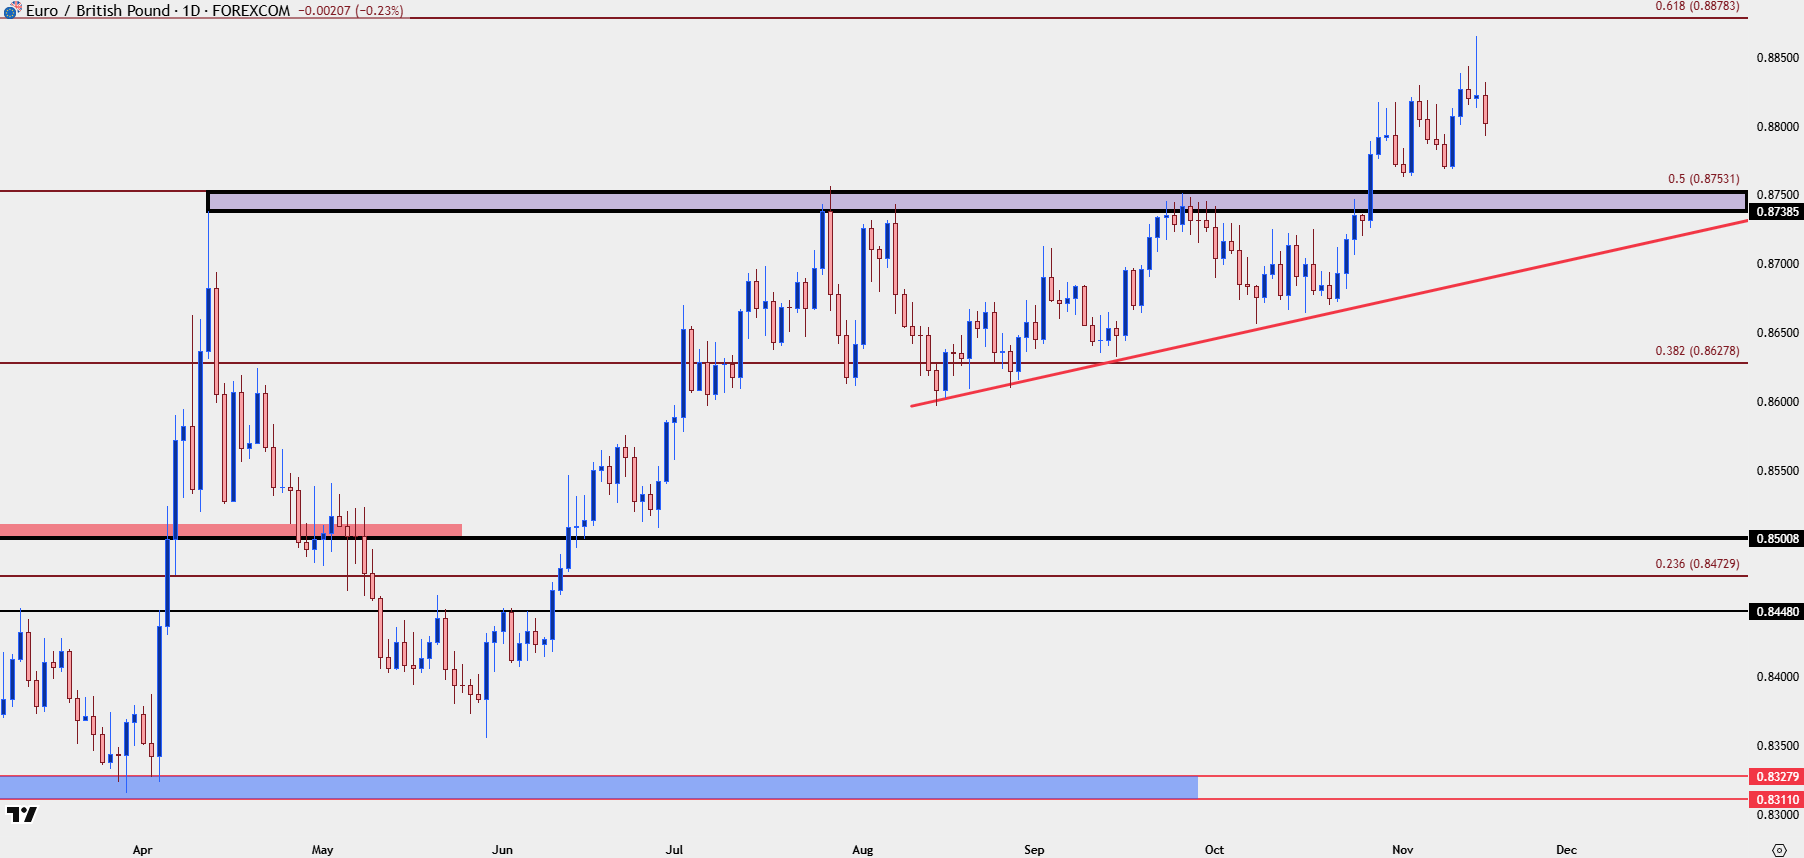
Chart prepared by James Stanley; data derived from Tradingview
--- written by James Stanley, Senior Market Analyst, Global Macro