
Canadian Dollar, USD/CAD Talking Points:
- USD/CAD put in a strong rally this week as USD-strength showed after the Fed’s rate cut in the prior week.
- USD/CAD remains as one of the more attractive pairs for USD-strength as I’ve been saying for the entirety of Q3. If we are on the cusp of a repeat of last Q4, when the Dollar rallied even as the Fed cut rates, USD/CAD remains a viable venue for that continuation.
- I’ll be looking into USD/CAD during the Tuesday webinar and you’re welcome to join. Click here to register.
It certainly hasn’t been fast, but it has been rather clean from a technical perspective. USD/CAD has put in a turn over the past three months and even though USD-strength was very much on the back burner for most of the quarter, USD/CAD continued to show clean bullish price action from weekly and daily charts.
There’s been some simply dynamics at play, such as psychological levels at 1.4000, 1.3750 and even the 1.3500 level. That’s helped to build an ascending triangle formation that ran into late-July, with bulls finally posing a breakout around the Fed rate decision that month.
The USD hurriedly turned over after the NFP print on August 1st, but in USD/CAD, the pair merely pulled back to support at 1.3750, taken from prior ascending triangle resistance, and that held the lows until bulls could come back for another run. Another two higher-lows showed after, most recently on last week’s rate cuts from both the BoC and the Fed and as I highlighted in these articles, a hold of a higher-low kept the door open for more.
That higher-low held by one-tenth of a pip, and was followed shortly after by a strong rally in the USD that drove USD/CAD up to a fresh two-month high. The pair now is moving faster towards that 1.4000 level and the prospect of USD-strength in Q4 doesn’t seem so outlandish at this point.
USD/CAD Daily Chart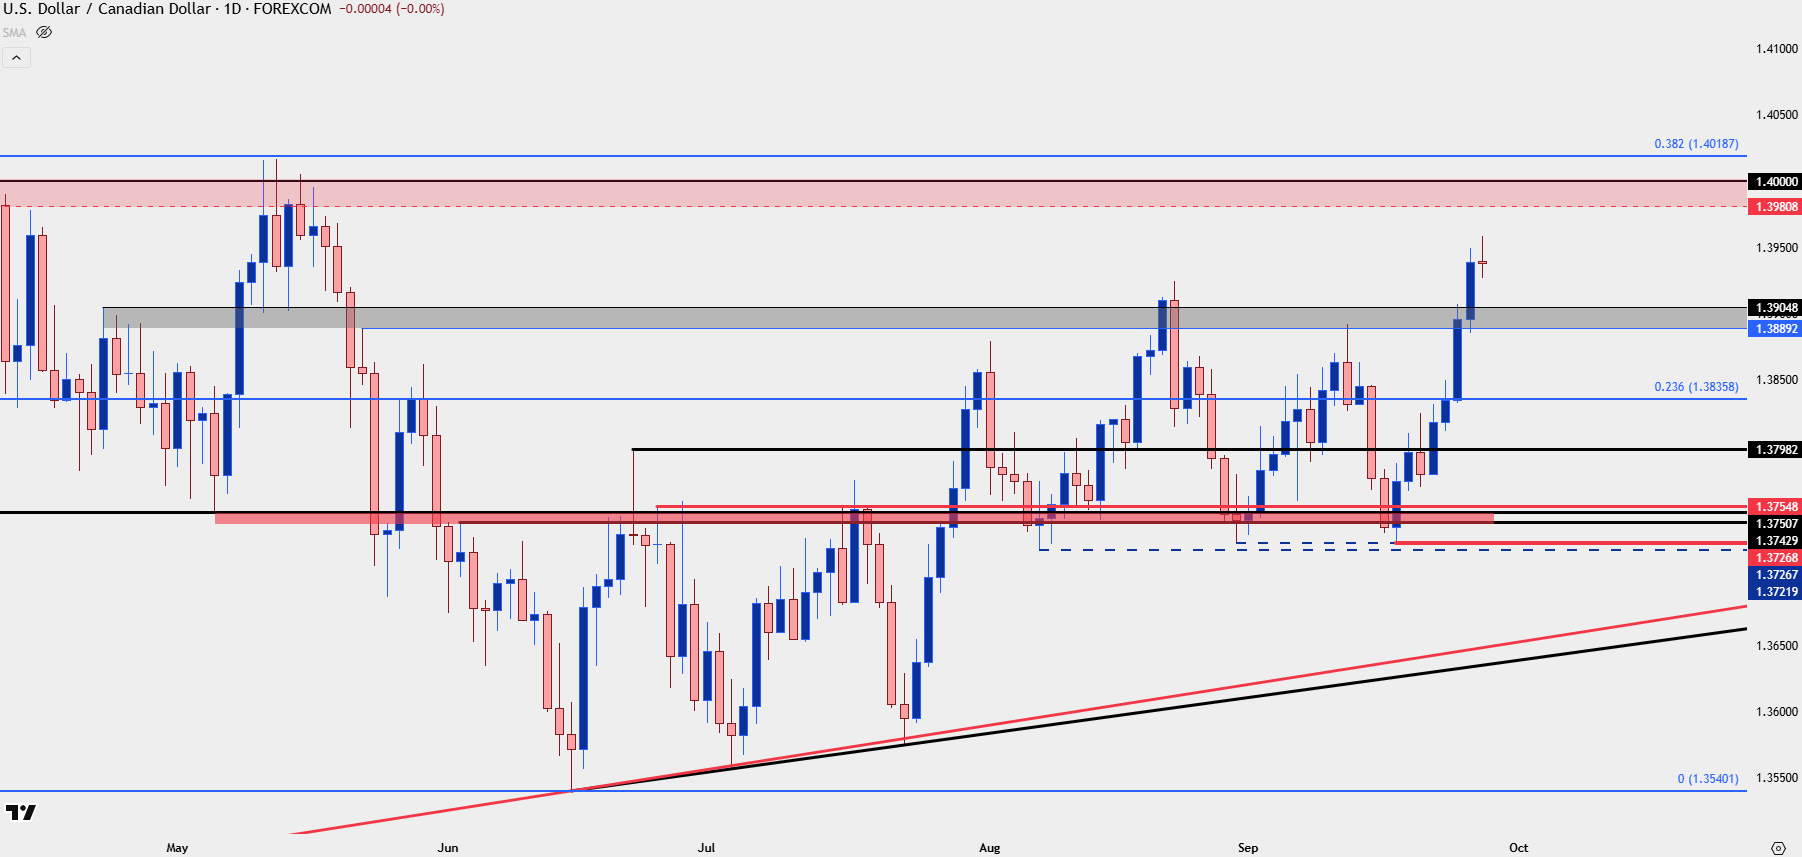
Chart prepared by James Stanley; data derived from Tradingview
USD/CAD Bigger Picture
I’ve long said that bullish approaches keep the door open for a re-test of the 1.4151-1.4178 zone. That area seems particularly important as it was a spot of resistance-turned-support when the pair was in the parabolic move late last year and into early 2025 trade. USD/CAD fell hard around the liberation day announcement, and there hasn’t yet been a re-test of that zone but there’s also now a key level there as the 50% mark of the 2025 sell-off is in that same confluent zone. That’s the spot to look for resistance and if that comes into play, especially if it comes into play soon, USD bulls might be making a larger mark and the prospect of continuation would be a different conversation at that juncture (again, think Q4 of last year).
USD/CAD Weekly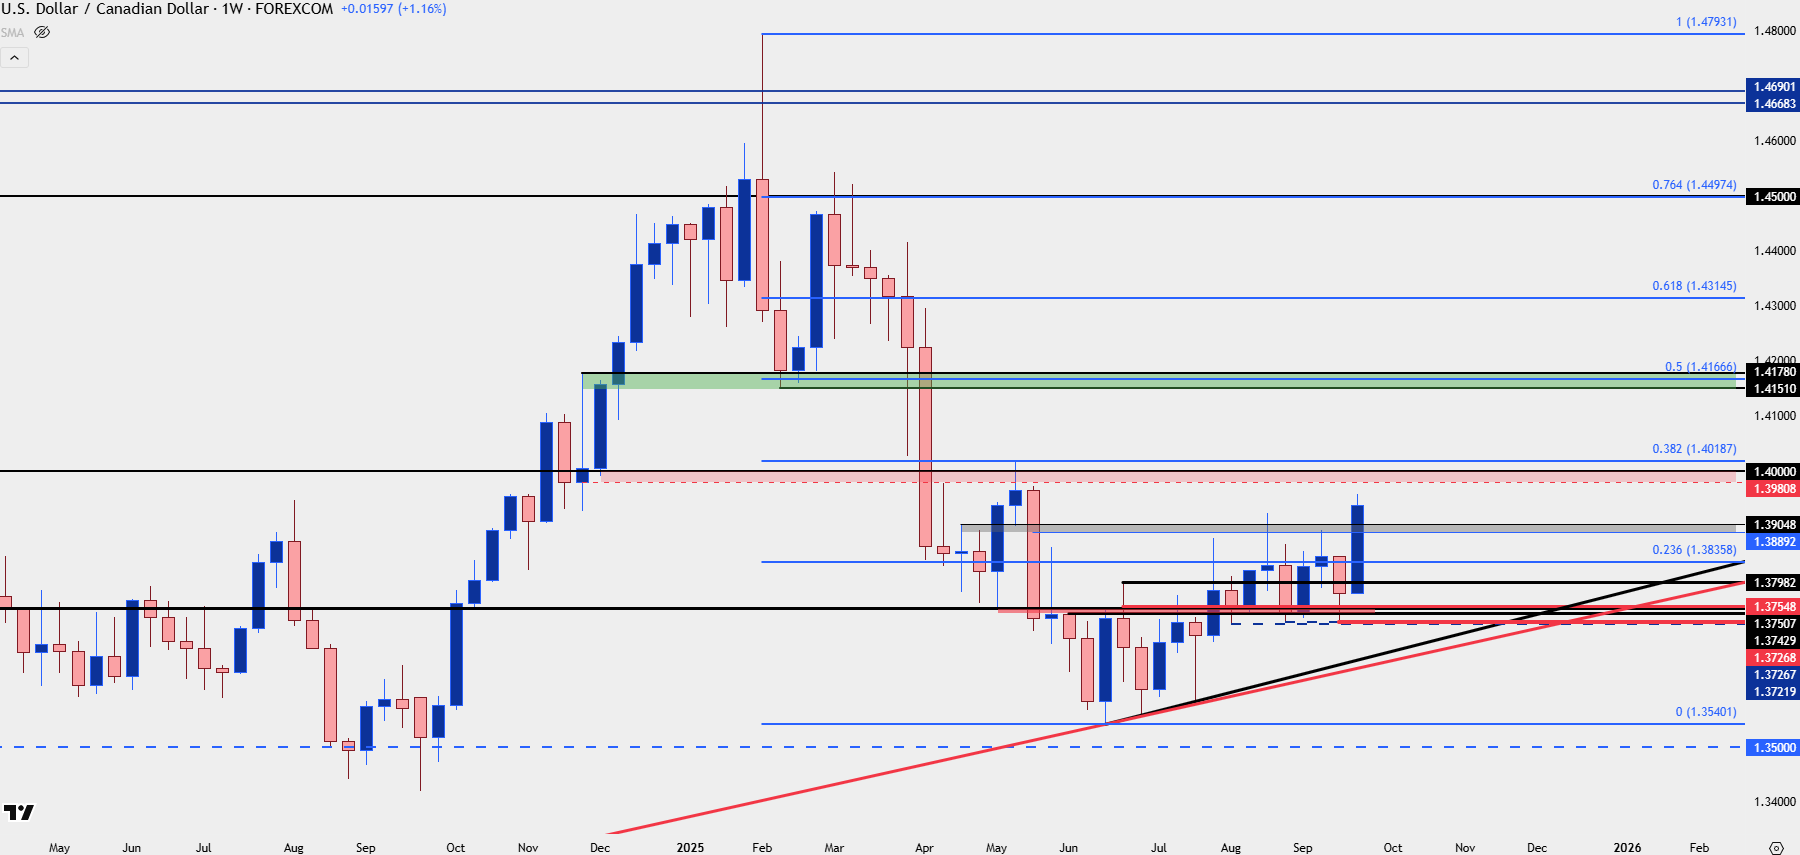
Chart prepared by James Stanley; data derived from Tradingview
USD/CAD Strategy
But until then, the challenge is the 1.4000 level. This was a key spot back in May as it held the initial bounce from 1.3750 – and the price action on the daily was clean with that test, as there were a series of upper wicks with lower-highs showing the waning power of buyers until sellers eventually were able to elicit a breakdown in the pair.
If that level is going to play as resistance, it also brings impact on near-term strategy, as topside targets would be somewhat limited. This also highlights the possibility of pullback and in this case, there’s a couple areas to track for higher-low support, such as the 1.3900 zone of prior resistance, or perhaps even the Fibonacci level at 1.3836, both of which would constitute a higher-low from the prior week support inflection.
USD/CAD Four-Hour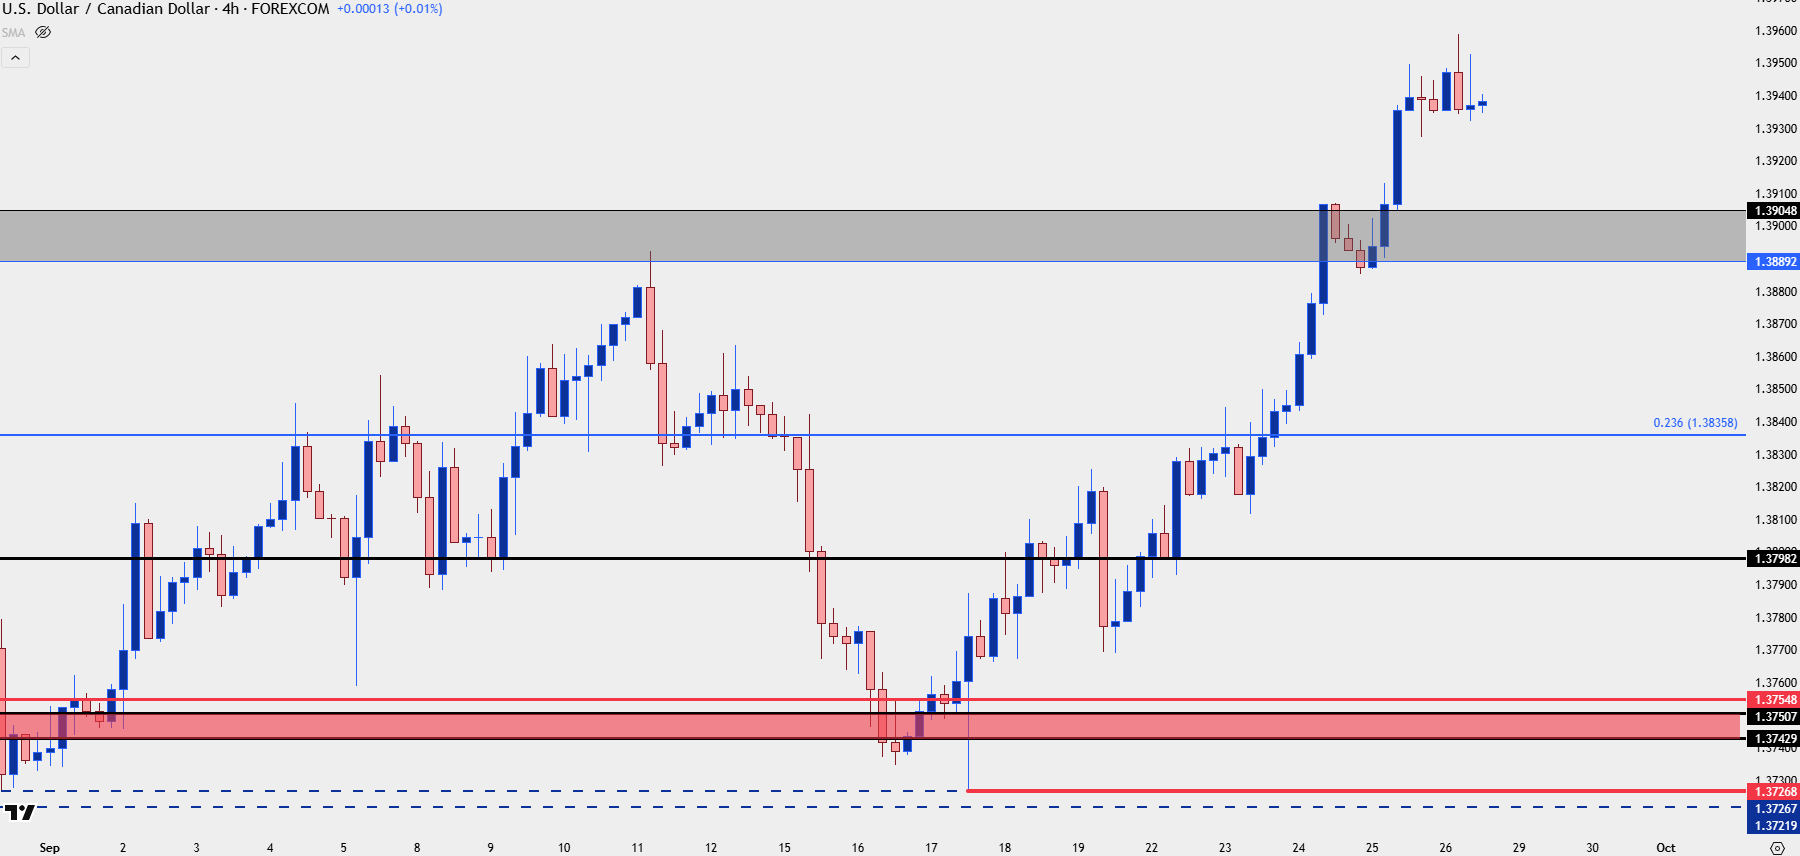
Chart prepared by James Stanley; data derived from Tradingview
--- written by James Stanley, Senior Strategist