
Key Events
- UK monthly GDP fell back to -0.1%, while preliminary GDP dropped to 0.1%.
- UK unemployment rate rose to 5%, the highest level since 2021.
- The longest U.S. government shutdown in history has ended.
A series of negative UK economic reports this week highlighted renewed pressure on growth. The unemployment rate rose to 5%, matching levels last seen in 2021, while GDP slipped to -0.1%, signaling growth risks amid persistent inflation.
The UK inflation rate remains elevated at 3.8%, well above the 2% target, keeping the economic tone sticky as the GBP pair holds near a critical support zone around 1.3130. This level could define whether the pair confirms a bullish continuation toward yearly highs or faces a deeper retracement of 2025 gains.
Meanwhile, the end of the U.S. government shutdown has eased haven demand for the U.S. dollar, providing short-term support to major currencies, including the British pound.
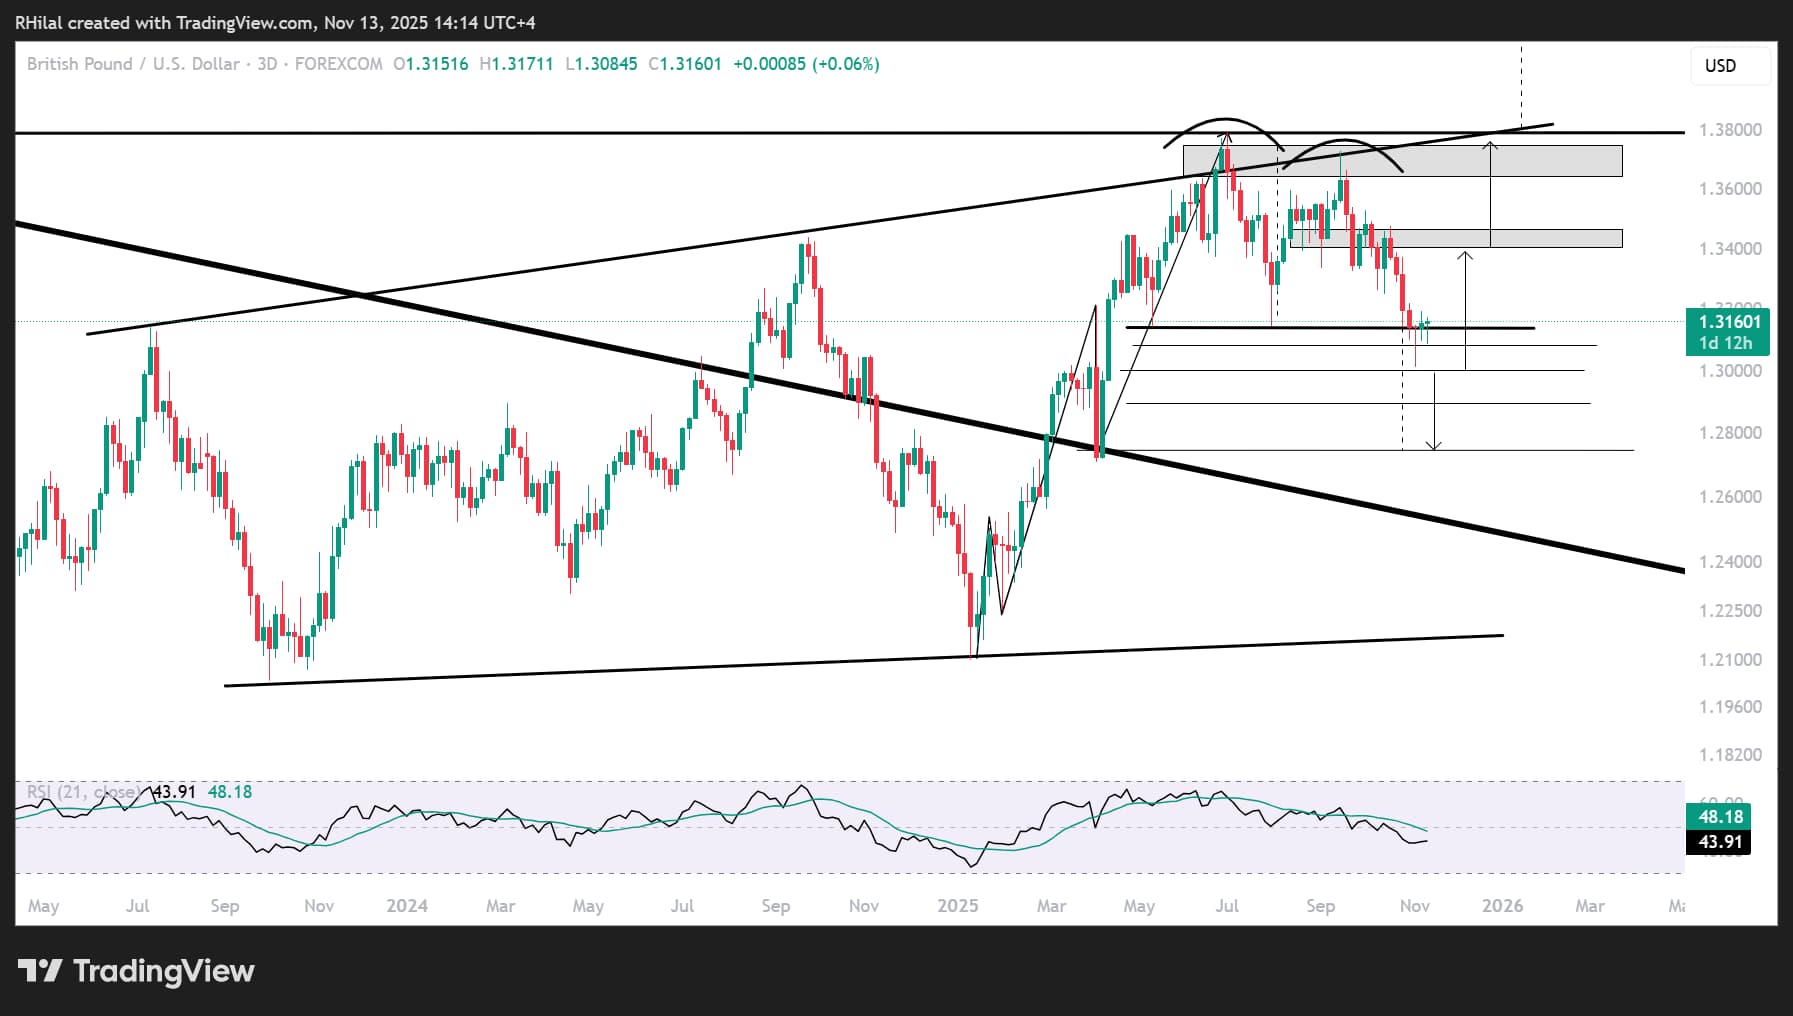
GBPUSD Outlook: 3-Day Time Frame – Log Scale
Source: Tradingview
On the 3-day chart, clear resistance appears near the 1.38 yearly highs, where price has already reversed twice, raising the risk of a potential double-top pattern around the 1.3130-zone.
A decisive move below the 1.30 mark could extend another leg lower, targeting 1.27, the April 2025 low, as part of the double-top projection.
On the upside, a neutral-to-bullish hold above 1.3130 — followed by a confirmed break above 1.32 — could open the door for gains toward 1.3280 and 1.3450, before retesting the yearly high at 1.38.
GBPUSD Outlook: Monthly Time Frame – Log Scale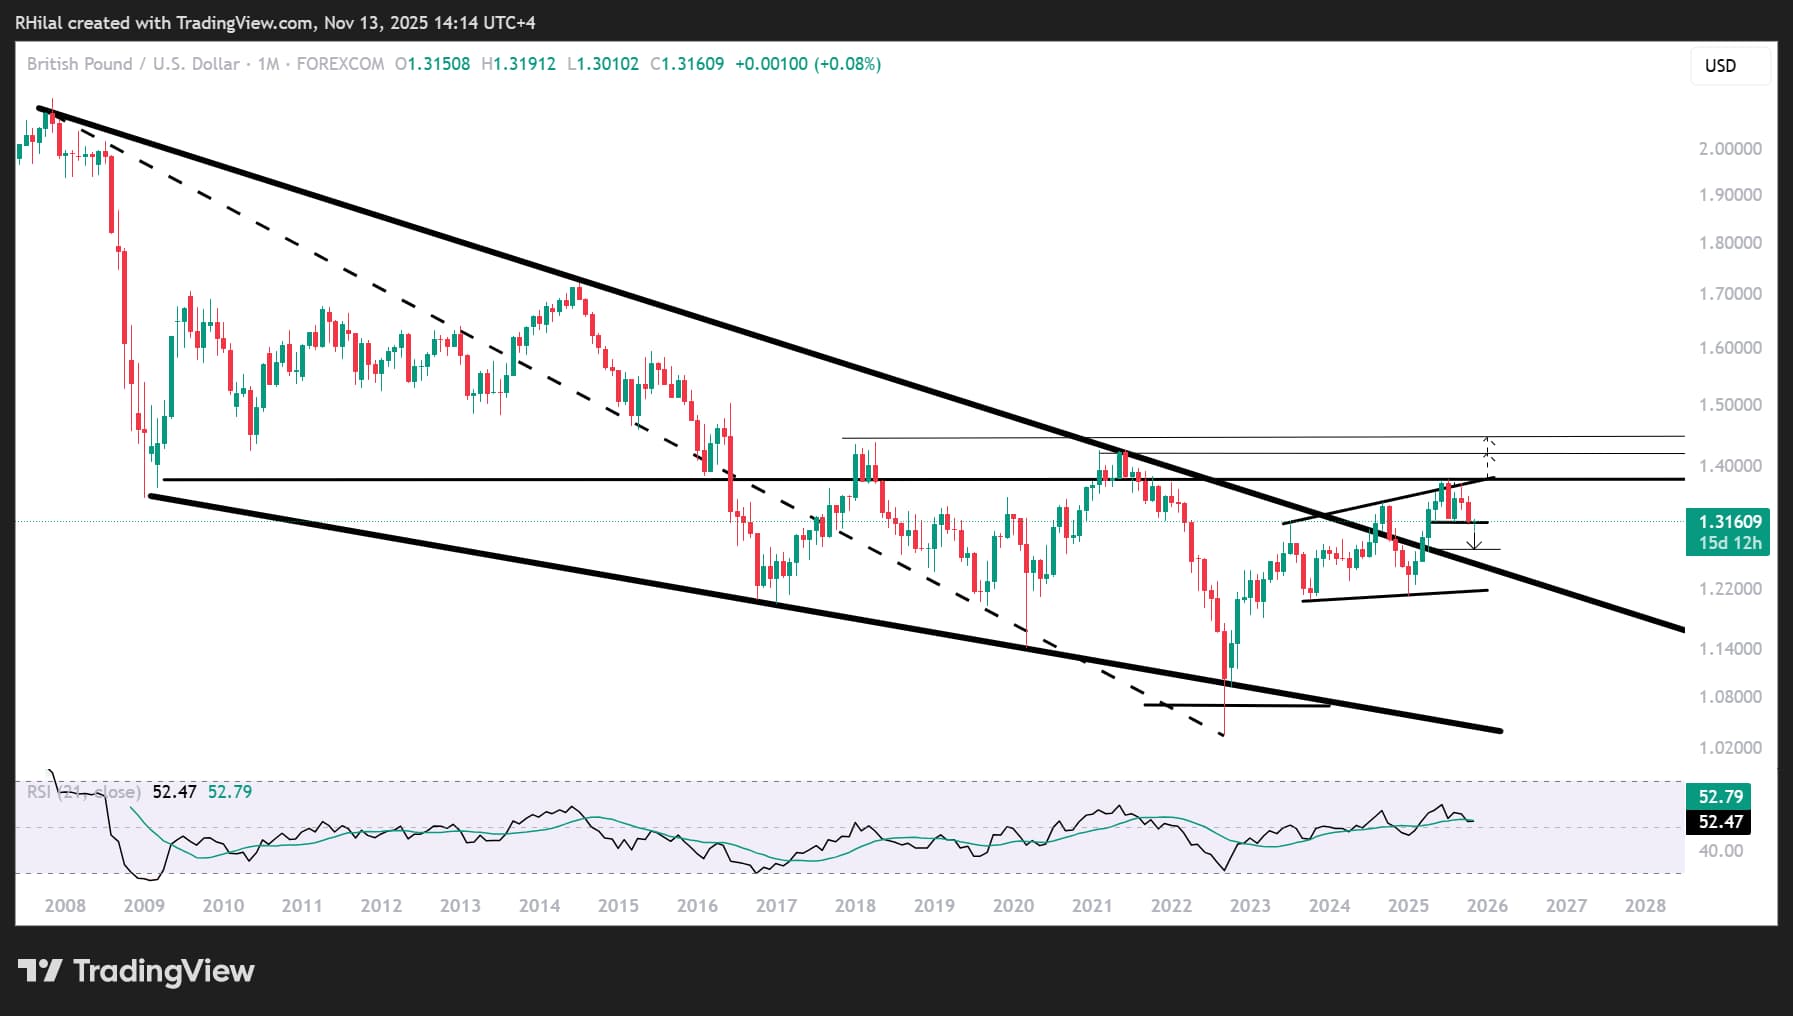 Source: Tradingview
On the monthly chart, GBP/USD continues to trade within an expanding consolidation pattern that began in July 2023, while also remaining above a contracting structure that has persisted since 2008. Together, these patterns define the short-term and long-term boundaries for the pair.
From the downside, price action may retrace to recharge 2025 gains near the 17-year boundary, with 1.27 serving as a strong support. A break below it could expose the 1.25 zone.
From the upside, a sustained hold above the yearly high at 1.38 — and beyond the broader consolidation — would expose the next resistance levels near 1.42 and 1.44, last seen in 2021 and 2018.
Written by Razan Hilal, CMT
Follow on X: @Rh_waves