John Templeton said that “the time of maximum pessimism is the best time to buy, and the time of maximum optimism is the best time to sell.”
While we can’t be sure as to whether we’re at peak pessimism in gold, we’re certainly nowhere near maximum optimism. The rally in gold began to stammer right around the two-year mark, following the two-day period back in 2024 when gold prices closed below the $2k handle ahead of Austan Goolsbee’s ‘let’s not get flipped out’ comment following a stronger-than-expected US CPI report.
In the two years since, there’s been a few different pockets of opportunity for buyers to join the fray as bull pennant formations built. But none has entailed the carnage that we’ve seen over the past three and now almost four weeks as prices have dropped by a maximum of -26.8%. By comparison, the sell-off in the back two months of 2024 was just over -9% while the four-month sideways build last year peaked at -10.83%. And then in Q4 of last year, the pullback ran for -11.3% before buyers came in and pushed back above the $4k handle, creating another parabolic extension of an already parabolic trend.
Gold Weekly Chart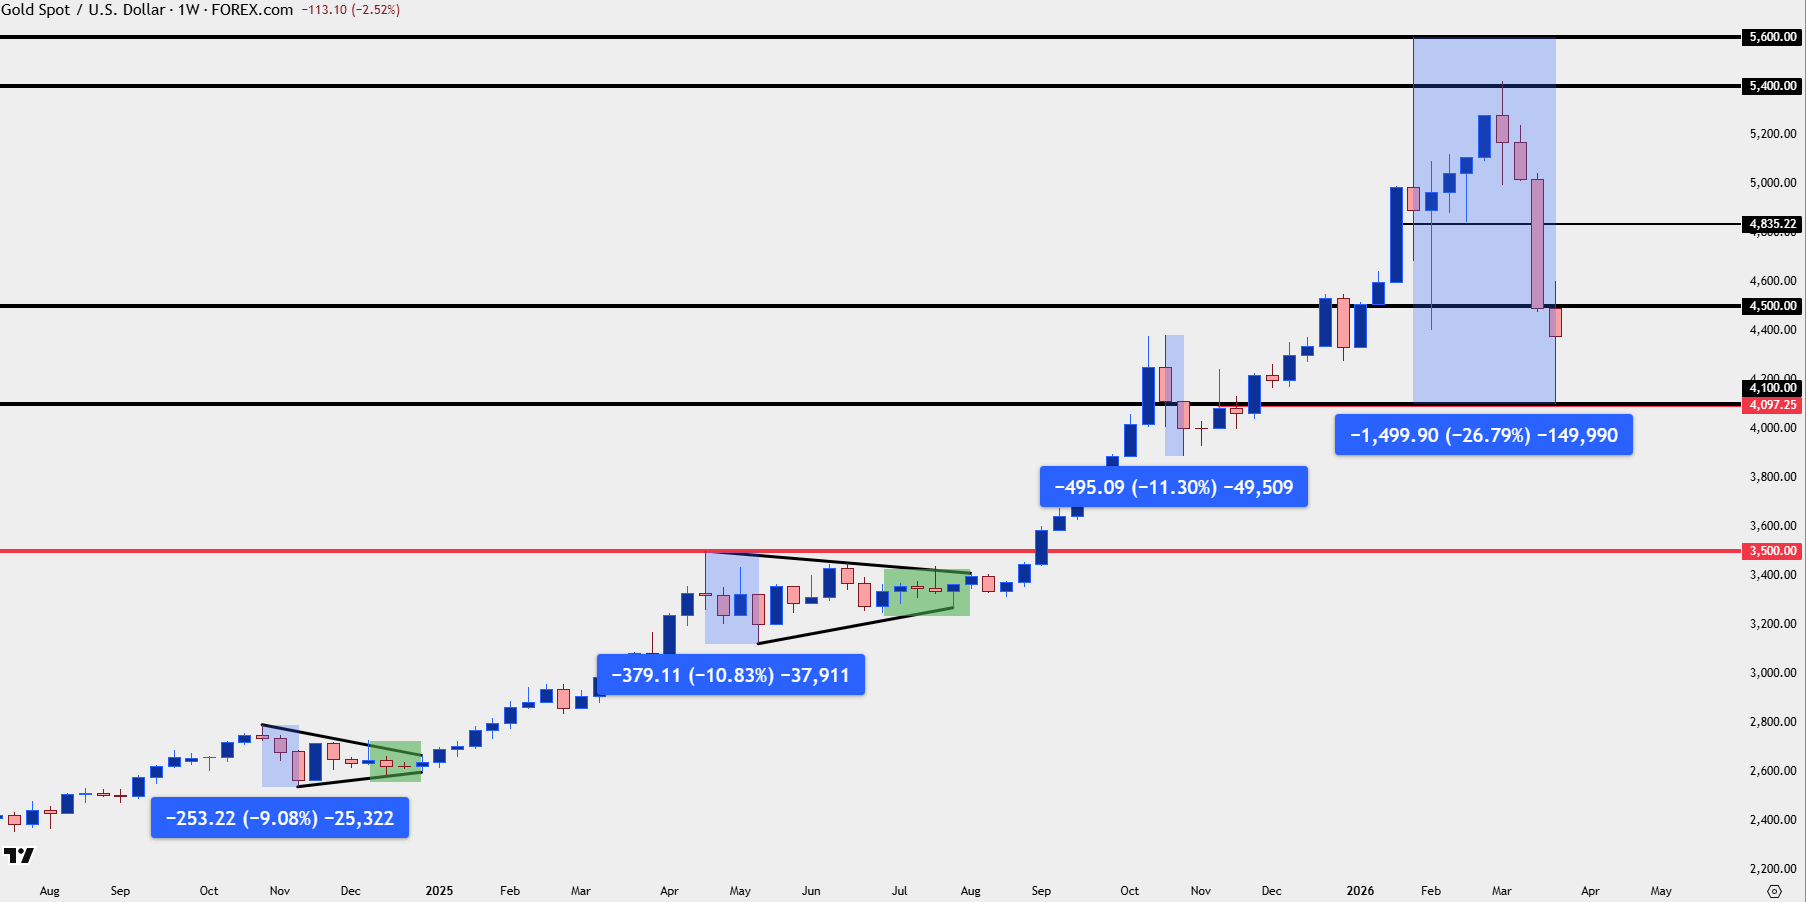
Chart prepared by James Stanley; data derived from Tradingview
Gold Pullback: Structural or Game-Changing?
At this point from the chart it’s difficult to argue that the worst is yet behind gold but that is a scenario that could come to fruition if the chips fall a certain way. Given the early-week reaction at $4100 which has left an elongated underside wick on the weekly chart, buyers can make a statement if they close the weekly bar closer to the $4500 level that came into play at the end of next week.
From the weekly chart that would produce a dragonfly doji, and if buyers can press the close over that level, we may even have a hammer formation to work with.
Even a close over $4400 could be considered a win for bulls as that response following the prior week sell-off would highlight buyers stepping in at a ‘perceived value’ following the test of $4100.
Shorter-term, the picture is less bright which I’ll look at in a moment.
Gold Weekly Price Chart: Scenario Plotting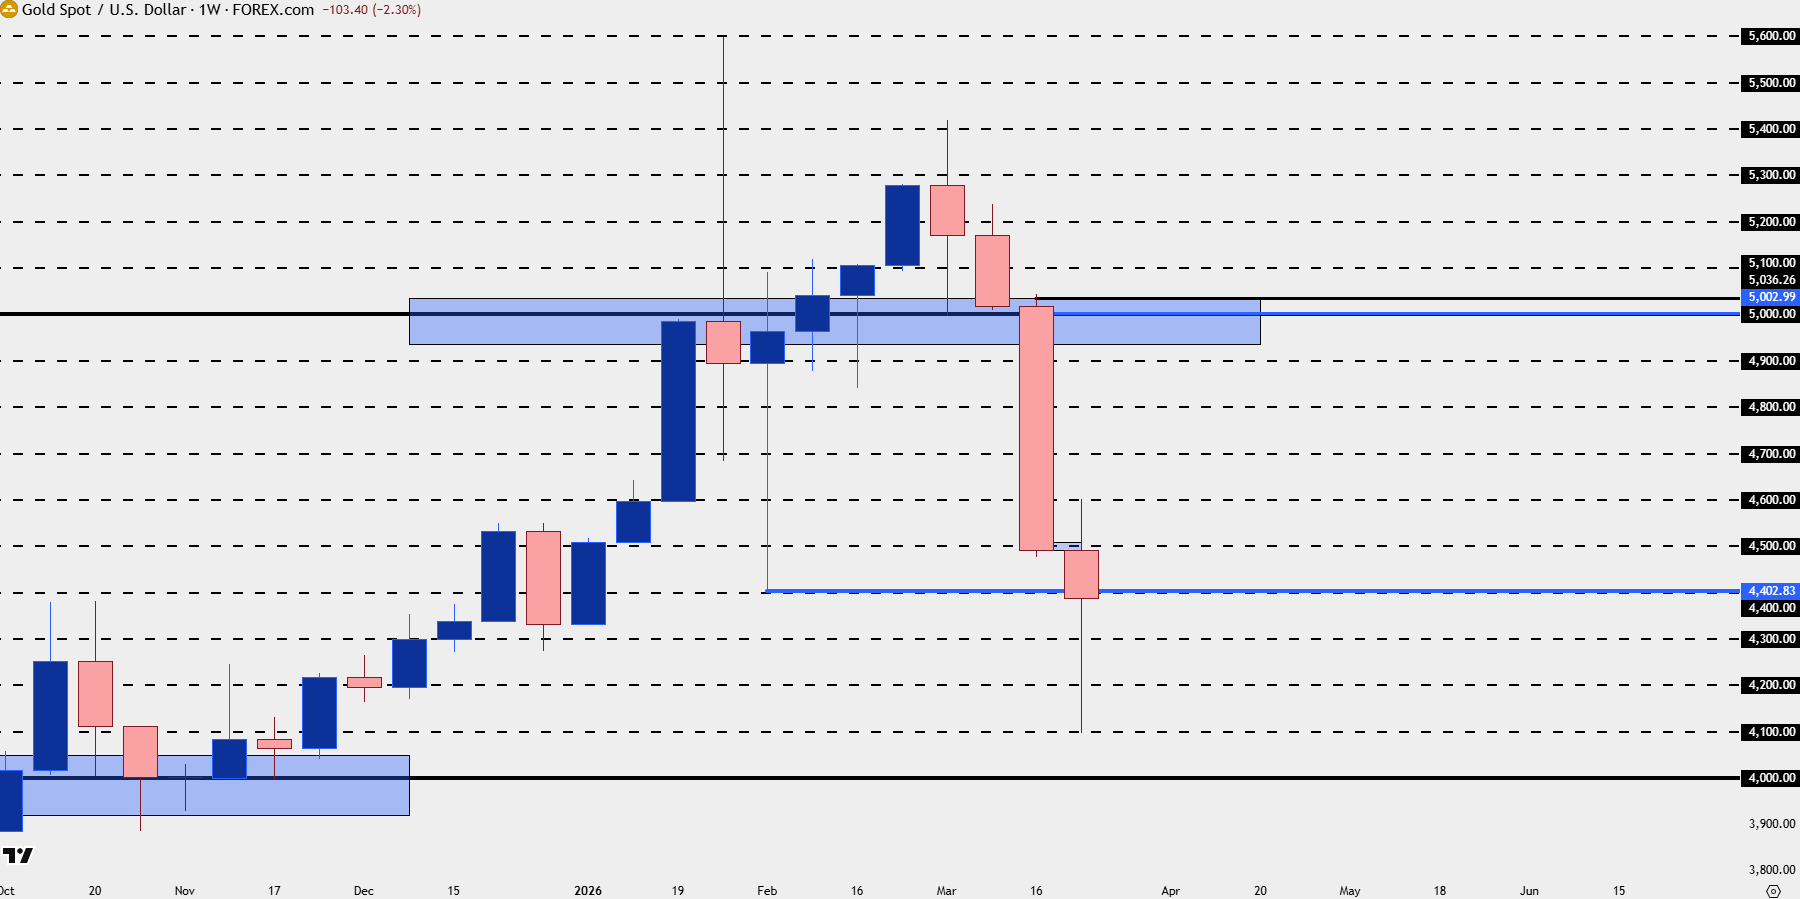
Chart prepared by James Stanley; data derived from Tradingview
Gold Daily
The daily chart highlights something that I think is notable and that’s the continued inflections at rounded psychological levels. I know this is a simple analytical methodology often dismissed as it’s not something that can be considered as ‘advanced’ technical analysis but I think the below chart speaks for itself, such as the Monday low right at $4100 or the Tuesday low at $4300. That then led to the Wednesday high of $4600.
I think the value of something like this is how it can be used for intra-day strategy: If you see a support bounce or a resistance hit developing at one of these levels, there’s the possibility of a swing. And given that the line-in-the-sand or the level is fairly clear, so too is where one would know that they’re setup is wrong or not working out. And risk management is a big part of the strategy implementation part of the equation.
But, also clear is the structuring here where the early-week bounce has so far found sellers and from the daily chart, that $4600 resistance inflection can be argued as a lower-high, with the question now whether buyers can or will return to hold a higher-low above the $4300 swing from Tuesday’s candle. If so, and if we do see a forward push higher, it’s the $4700 level that would be next up as resistance in this sequence if $4600 gets taken out.
Gold Daily Price Chart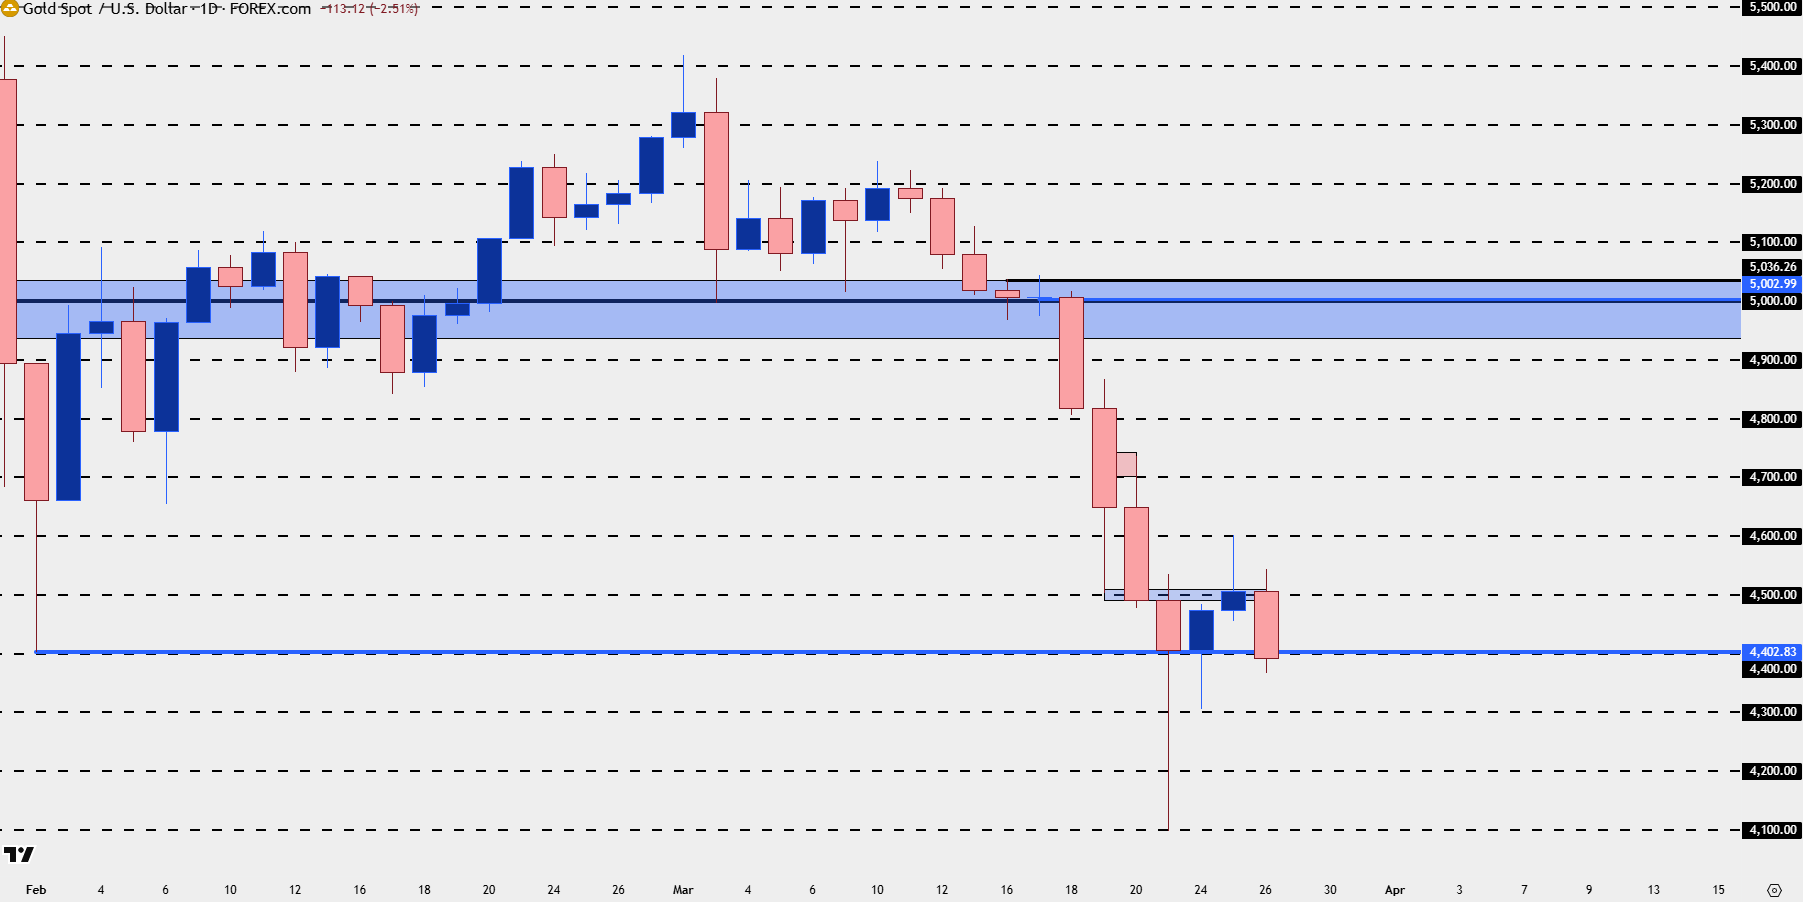
Chart prepared by James Stanley; data derived from Tradingview
Gold Short-Term Consolidation
The four-hour chart is more consolidative as that $4600 resistance inflection has led to a push below $4500 and as of this writing, $4400. That sets up the bigger test as to whether buyers can hold a higher-low over $4300 and if they can’t, the door opens for re-test of $4100 with $4200 as an obvious level of interest along the way.
But aligning the time frames looked at above, a weekly close over $4500 sets up for a larger bullish reversal setup and a close above $4600 sets up the hammer formation. So there is hope for bulls depending on how this weekly bar can finish.
Gold Four-Hour Price Chart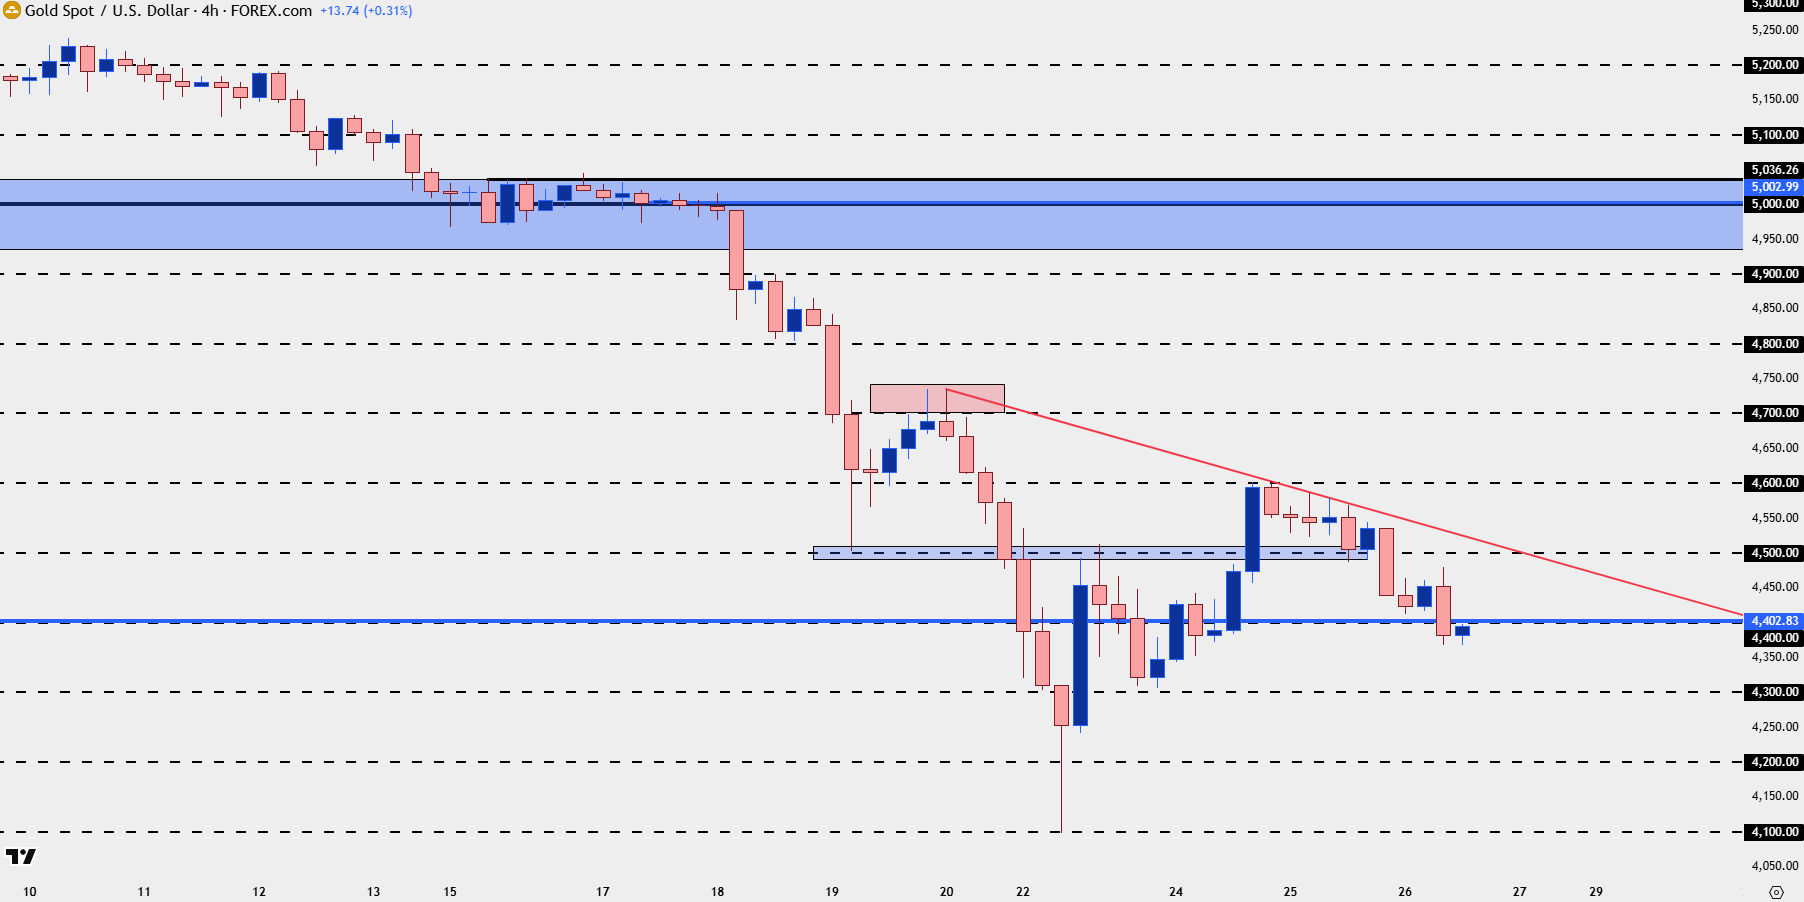
Chart prepared by James Stanley; data derived from Tradingview
--- written by James Stanley, Senior Market Analyst, Global Macro