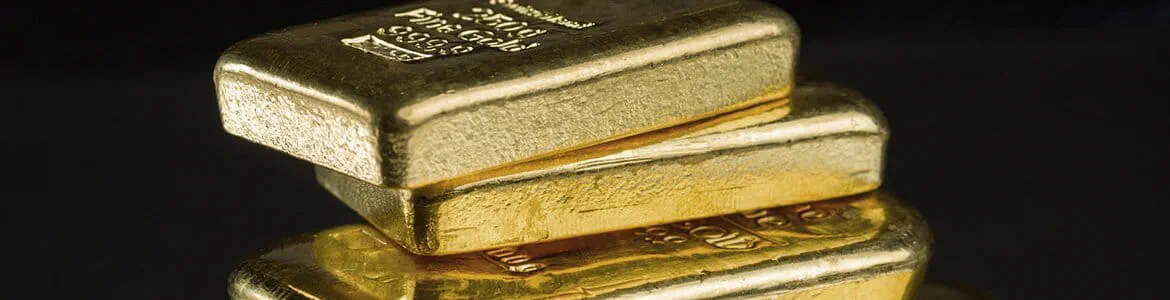
On Wednesday, spot gold continued to consolidate within a narrow range and ended up 0.1%, while spot silver surged 1.0% to its highest level since September last year.
Earlier today, official data showed that China's 2Q GDP grew 3.2% on year, above consensus forecast of +2.4%. However, industrial production rose 4.8% on year in June as expected, while retail sales declined 1.8%, compared with +0.5% estimated, possibly suggesting that the recovery in the recent month is somewhat lagging behind expectations.
Later today, U.S. retail sales data for June will be released (+5.0% on month expected). It remains to be seen if investors' optimism, regarding economic recovery, eases further.
From a technical point of view, spot gold remains trading within a bullish channel drawn from June as shown on the 1-hour chart, but has yet broken above a broadening pattern in the shorter term, suggesting that it is consolidating after the recent rally. The level at $1,800 may be considered as the nearest intraday support, while a break above the nearest resistance at $1,818 would open a path to the next resistance at $1,825. Alternatively, losing $1,800 might suggest that the next support at $1,792 is exposed.

Source: TradingView, Gain Capital