
Gold Technical Outlook: XAU/USD Multi-Timeframe Analysis
Gold price support is under pressure as gold heads for a seventh weekly loss in nine, and a weekly close below the zone would confirm the break. Michael Boutros, StoneX Media Senior Market Analyst, walks through gold's weekly, daily, and intraday charts and the technical zones that define the trend. A weekly close below the confluence of a 78.6% Fibonacci retracement and a trend line from May of last year would validate a break of the October opening range, while a daily close above the monthly open would suggest a more durable near-term low. Beyond the charts, the Federal Reserve rate decision and the core Personal Consumption Expenditures price index release the following day stand out as the next major catalysts for gold.
This content was created by an affiliate of FOREX.com and represents the views and opinions of the author/speakers, not the views and opinions of Forex.com, StoneX Group Inc., or its subsidiaries. The content has not been independently reviewed by FOREX.com.

Key USD Economic Data Releases
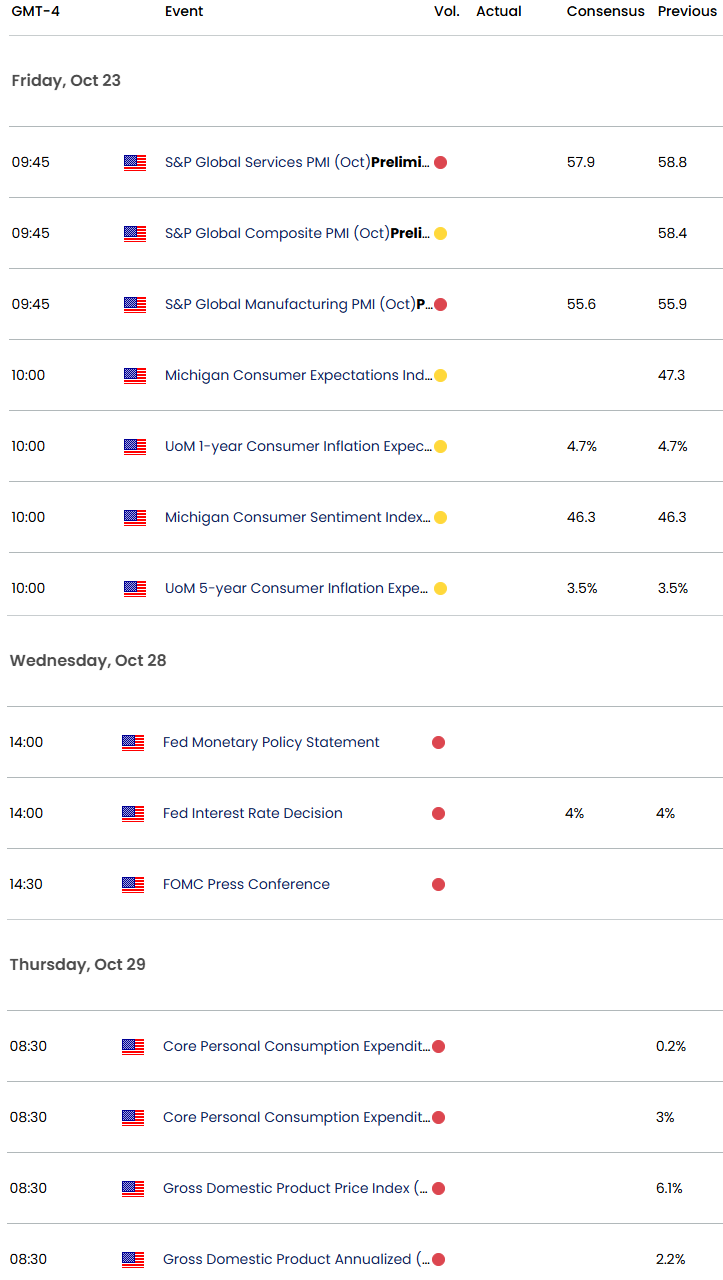
Economic Calendar - latest economic developments and upcoming event risk.
Active Short-term Technical Video Updates
- Swiss Franc Technical Outlook: USD/CHF Reversal Puts Major Support in Focus
- Euro Technical Outlook: EUR/USD Bulls Face Critical Test After Support Rebound
- US Dollar Technical Outlook: DXY, Treasury Yields Retreat Despite Hot CPI
- Australian Dollar Technical Outlook: AUD/USD Trend Break Faces Immediate Test
- British Pound Technical Outlook: GBP/USD Bulls Fight to Stabilize at Critical Support
- Canadian Dollar Technical Outlook: USD/CAD Five-Week Rally Sets Up Major Breakout Test
--- Written by Michael Boutros, Senior Technical Strategist
Follow Michael on X @MBForex