
S&P 500, Nasdaq Talking Points:
- SPX printed a red week after the prior week’s rate cut, but the trend has been aggressively bullish going back to the April lows.
- The Nasdaq 100 hit a fresh ATH this week but that was a whopping 50% away from the April lows, so a breather after such a strong rally makes sense. The question now is when or where will bulls come back in to push?

The current market environment in equities is somewhat of a confounding environment. I remember this from 1999, when as a fresh trader a simple look at the chart makes matters seem so simple. Line goes up, so look for it to go up even more. There’s the famous comment from Alan Greenspan about ‘irrational exuberance,’ which he dropped in 1996. This often gets referred to when looking at the tech bubble leading into the tech bust, what often gets missed is that Greenspan’s timing was lackluster as the Nasdaq 100 was up about five times from that remark to the ultimate high in Q1 of 2000.
So if Greenspan had opened shorts when he said that, he probably would’ve been margin called many times over before the reversal ultimately took hold. And interestingly, when stocks did finally top and the Nasdaq did turn over, it found support around the same area of resistance that was in-play in December of 1996, when Alan Greenspan gave that speech! Almost as if the market was trolling ‘the maestro.’
Three decades later and it seems that markets have only become more and more accustomed to asset bubbles and exuberant rallies. From tech to housing to social media to now AI, there’s constantly a reason for investors to lose their better sense and prudence and, instead, chase higher prices.
There’s been a common ingredient through it all and this is why I’ve remained bullish in forecasts for the past few years, even when the Fed was hiking or asset prices were stretched or valuations were getting outlandish, and that’s the fact that there seems little interest in restraint; in balancing a budget, in reining in government spending and looking at the big picture to ask whether this is all sustainable.
The problem with the current market environment is that for those that have been around the block, those that have tasted failure and margin calls along with the pain of ‘buying a top’ and watching it all come crashing down, is there’s very few risk-efficient ways to join in the move. With price constantly moving higher and higher with only minor pullbacks along the way, how can a trader get in the trend and set stops in a reasonable manner?
This is what I was talking about in the 2025 forecast for equities when stocks were in a similarly loaded scenario. As I said then, I thought a pullback would show, but I didn’t know the how or the why yet. The hallmark was a strong directional move that was seeing a slowing in gains, illustrating a top-heavy market that could turn, at some point, even if just for a little bit.
That turn showed up around the tariff announcement earlier in the year. And then suddenly bears showed up out of the woodworks, with some noted financial media members warning of a ‘black Monday’ type of event. Ironically, that turned out to be the low, and the Nasdaq 100 is up about 50% from that.
With stocks in a similarly loaded backdrop, there’s possibility of pullback and that’s probably one of the more attractive ways forward, as it can allow for more cogent risk management while still taking part in the trend. I wouldn’t necessarily want to look to get bearish, as all we have at this point is a case of indecision. But, this could be enough to cool on chasing and instead, look for prices to pullback to support at prior resistance, such as the 6500 level on SPX.
SPX Weekly Chart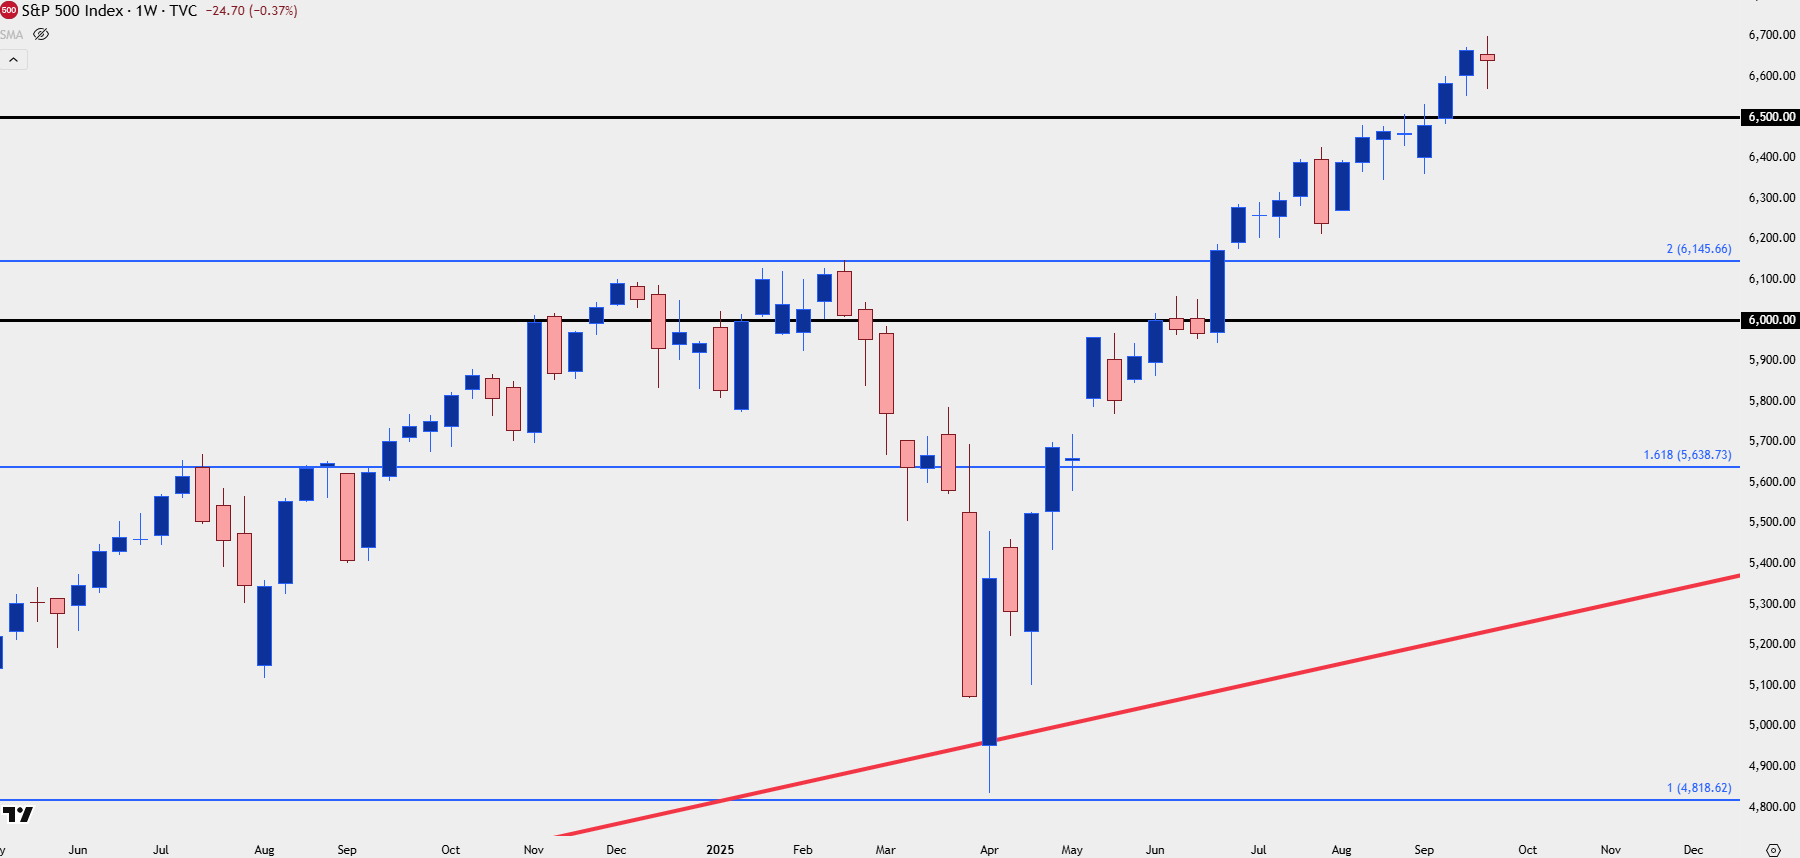
Chart prepared by James Stanley; data derived from Tradingview
SPX Daily
The daily char t of SPX has remained in a bullish trend channel for much of the prior four months and the support side of that was tested this week, following a gap down on Thursday that has since been filled on Friday. But – it’s the three-day action from Tuesday that illustrates that pullback potential.
As looked at above, 6500 is a big spot in SPX. There’s a couple of zones before that, however, around 6600 and 6550 and both of those could be looked at as shorter-term supports for those that do want to be more aggressive with the matter.
If SPX does lose 6500, then we may be in the midst of a larger pullback, and that’s where bulls might want to try to exercise a bit more patience in waiting for the next long setup.
SPX Daily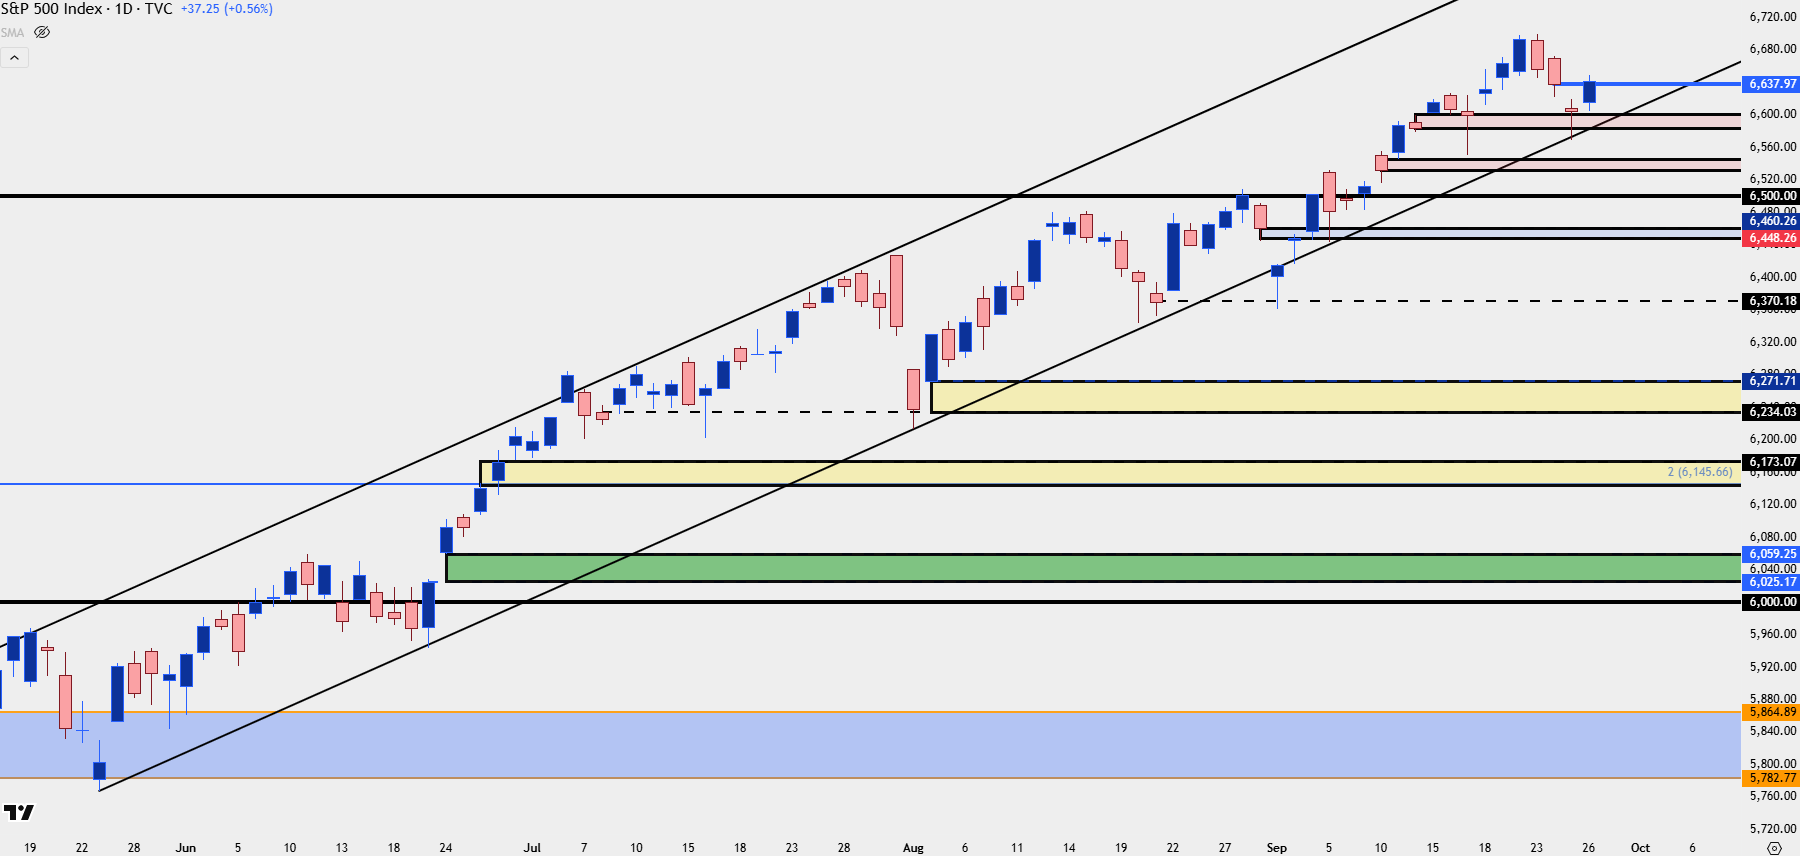
Chart prepared by James Stanley; data derived from Tradingview
Nasdaq
Tech was the big focal point in the 2025 equities forecast, largely due to the valuation aspect and comparison to the tech boom. The AI trade has been so aggressively priced that even the brightest of outcomes will have difficulty justifying the valuations; but with capital so ‘cheap’ on a relative basis and the Fed cutting rates even with high inflation, it’s still an attractive trade from a fundamental perspective.
The challenge now is the same as it was then, however, and that’s how to work with a market that’s in a severely overbought state.
There’s not many great options. Either chase it and run the risk of buying a top or be patient and try to catch a pullback, and run the risk of missing the trade. Newer traders often don’t mind the risk of the first scenario while experienced traders usually default to the second, as frustrating as it can often seem.
But the support highlighted in that 2025 forecast ended up marking the lows in April, right around that 17k level, and it’s from those lows that the index has gained a whopping 50% in a little more than five months.
This further illustrates that challenge, and again, there’s only a couple of ways to move forward even for the patient trader looking to work with pullbacks: Either go down to a shorter time frame and look for smaller pullbacks, which may just get ran through if it’s a larger pullback playing out, or just take a step back and wait for something bigger to develop.
In that case, it’s the unfilled gap around the 20k handle that looms large. Until then, there’s a shorter-term level at 23712 and a zone from 22763-22973 that are of interest for supports. Below that, there’s one more spot until the 20k area comes back in to play, and that spans from 21856-22041.
Nasdaq Weekly Chart
Chart prepared by James Stanley; data derived from Tradingview
--- written by James Stanley, Senior Strategist