
As the first week of November progresses, renewed weakness in the Japanese yen is once again becoming evident in the short term. This dynamic can be seen in the recent performance of USD/JPY, which has posted two consecutive bullish sessions and gained more than 0.7%, reflecting a return of buying interest in the dollar while the yen continues to lose momentum.
For now, the bullish pressure remains supported by expectations that the Federal Reserve could adopt a relatively more aggressive stance in upcoming policy decisions. This is being reinforced by the recovery in U.S. Treasury yields, factors that have helped strengthen the dollar and could continue supporting upside pressure in USD/JPY over the coming sessions.

What Happened with Central Banks?
Last week was particularly important due to the policy decisions from the Federal Reserve and the Bank of Japan (BoJ). Both institutions shared a similar message: despite acknowledging that inflationary pressures remain a relevant concern, they decided to leave interest rates unchanged and maintain a relatively cautious stance.
However, a divergence in expectations is beginning to emerge as the market looks toward the end of 2026. Throughout much of the year, the interest rate differential has favored the United States, with rates at 4.00% compared to 1.25% in Japan. This gap remains important because it continues to increase the relative attractiveness of dollar-denominated investments compared with those denominated in yen.
What is particularly relevant now is that, only a few weeks ago, investors expected Japan to gradually reduce part of this gap through additional rate hikes. Following the latest central bank decisions, that scenario appears less certain. For the December 9 Fed meeting, markets continue to assign nearly an 80% probability of a rate increase toward 4.25%. By contrast, for the Bank of Japan's December 17 meeting, the probability of a rate hike toward 1.50% remains close to 56%.
This suggests that markets currently have much greater confidence in an additional rate increase in the United States than in Japan. As a result, expectations that the Fed may ultimately remain more aggressive than the BoJ are gaining traction once again, reducing hopes that the rate differential will narrow meaningfully in the coming months.
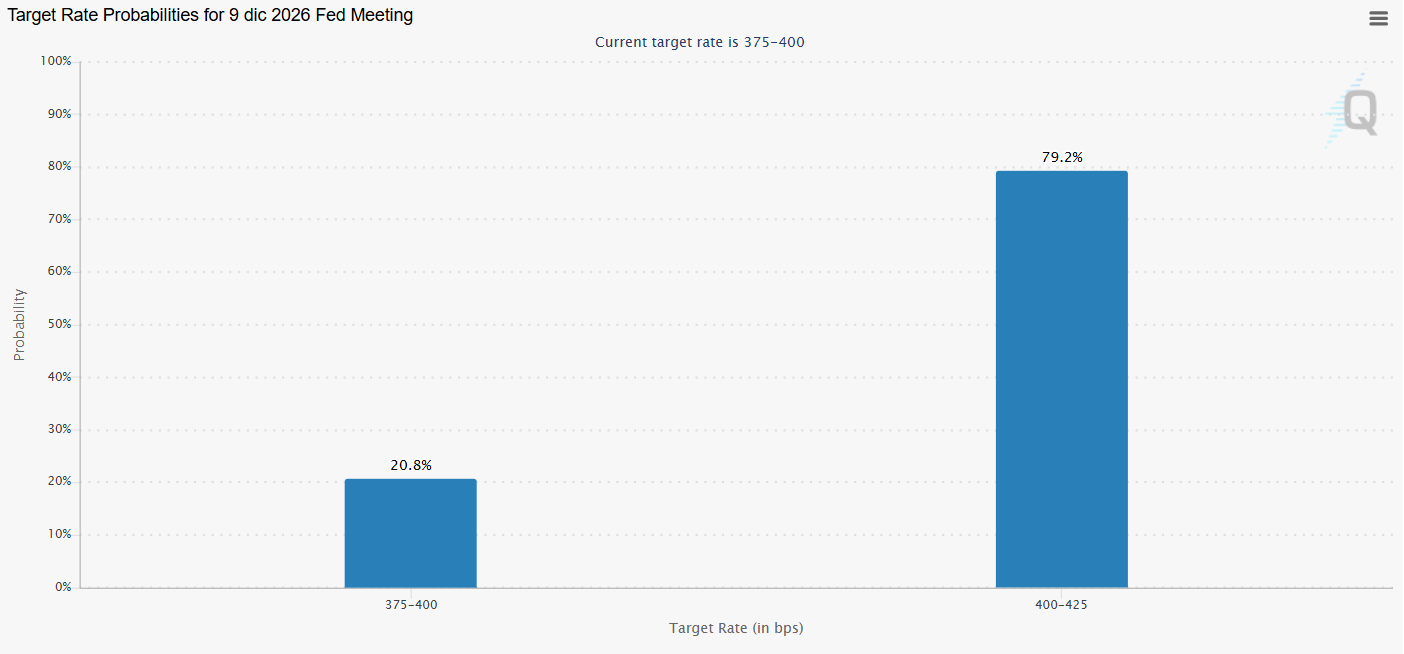
Source: CMEGROUP
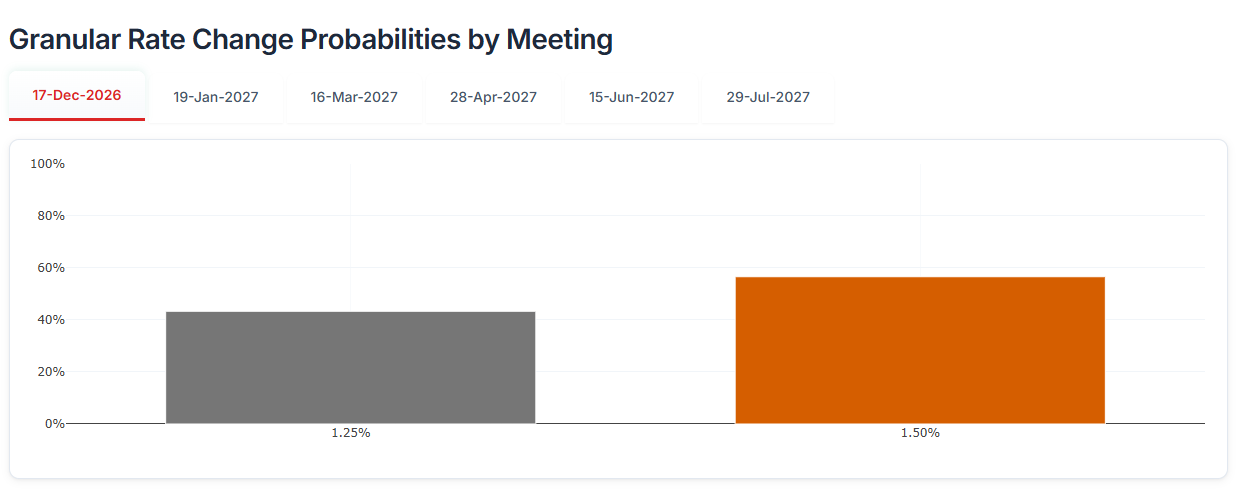
Source: Centralbankwatch
This dynamic is also being reinforced by recent developments in the bond market. U.S. 10-year Treasury yields have resumed an upward trajectory in the short term, supported by both monetary policy expectations and political uncertainty related to the midterm elections. As a result, yields have once again approached the 5.00% area.
Meanwhile, Japanese 10-year government bond yields continue to trade in a much more stable fashion, remaining close to 2.7% and showing little ability to close the gap with their U.S. counterparts.
This situation is important because, while U.S. yields continue to recover and Japanese yields remain relatively stable, the attractiveness of dollar-denominated investments continues to strengthen relative to yen-denominated assets.
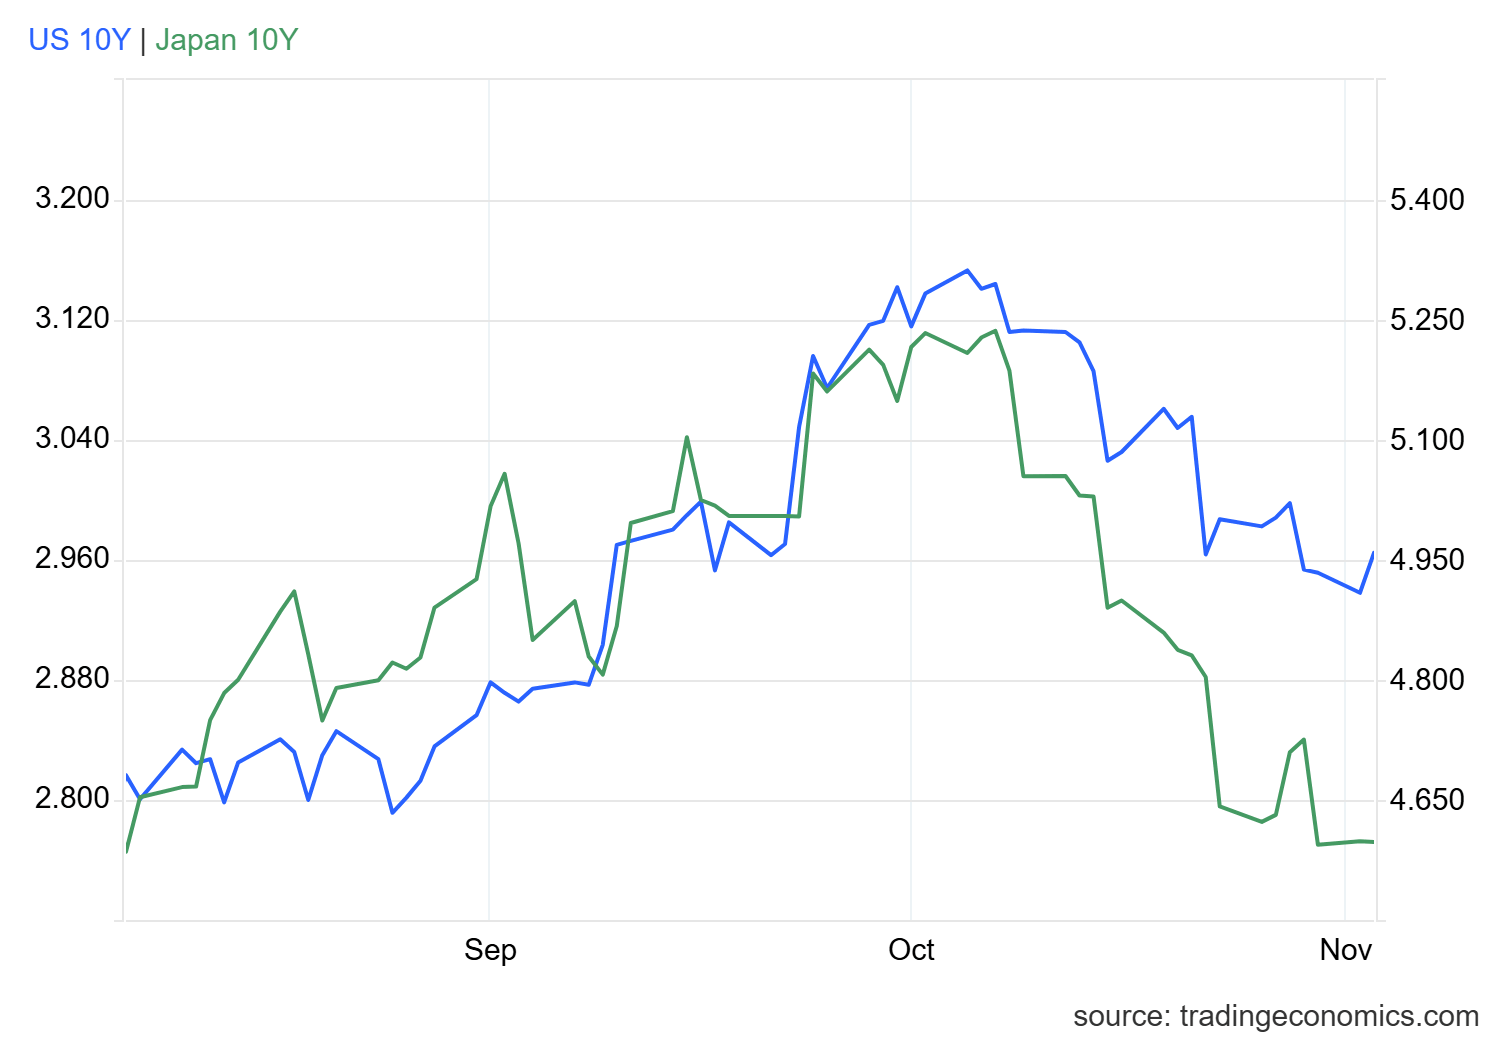
Source: TradingEconomics
With all of this in mind, expectations of a relatively more aggressive Federal Reserve, combined with the recovery in U.S. bond yields, continue to make it difficult for the Japanese yen to stage a meaningful recovery. As long as this backdrop remains in place, buying pressure around USD/JPY could continue to be a relevant theme in the sessions ahead.
USD/JPY Technical Forecast
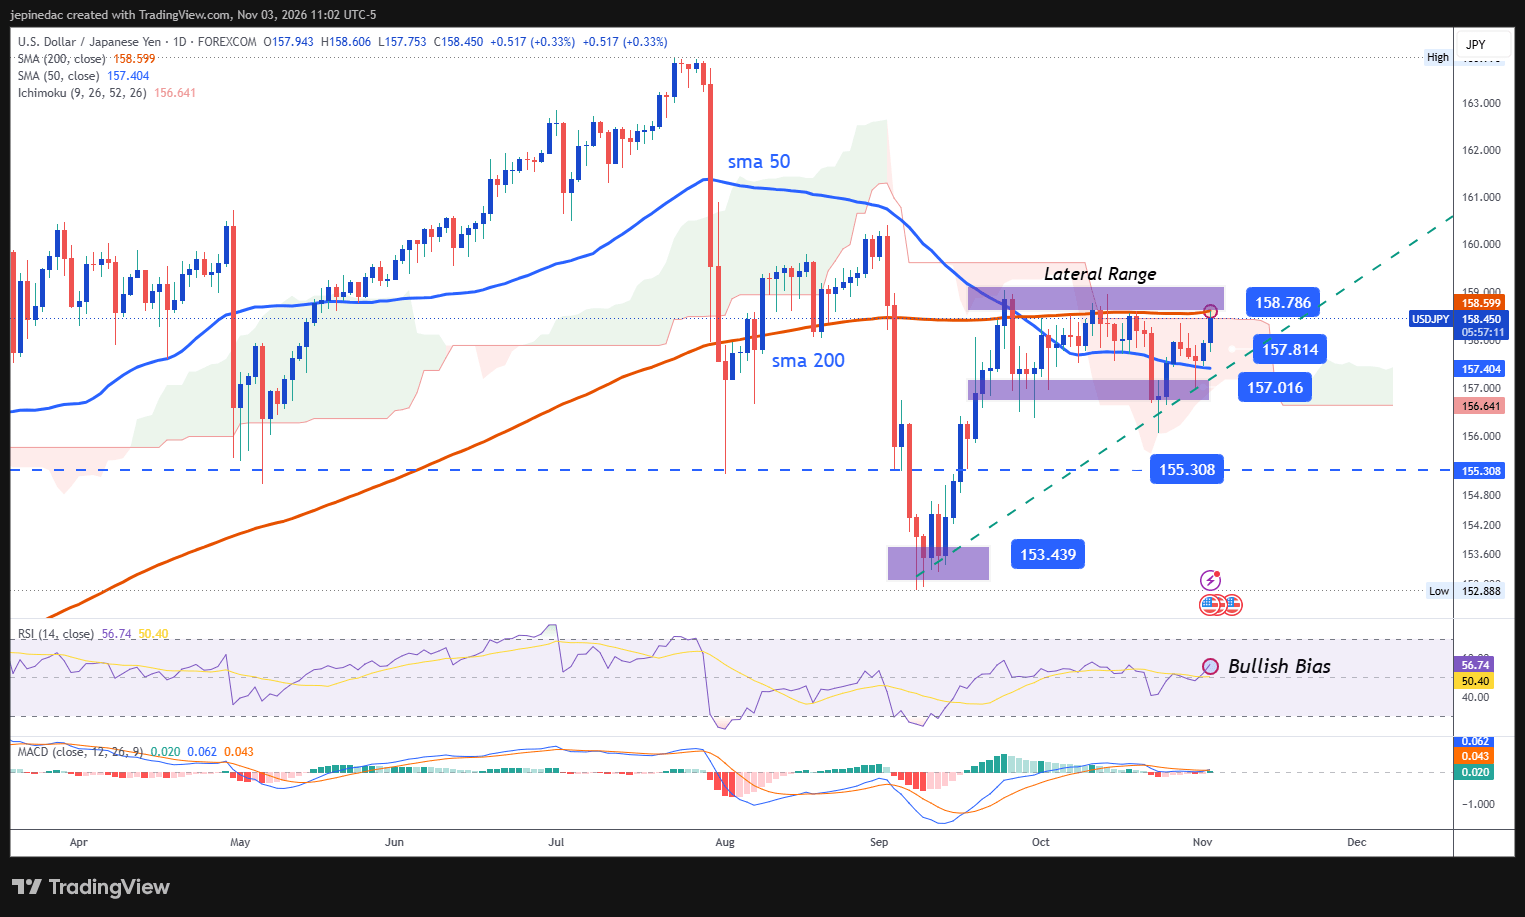
Source: StoneX, Tradingview
- The trading range remains intact: Although USD/JPY has managed to recover some bullish momentum in recent sessions, the move remains insufficient to break out of the range-bound structure that has dominated price action for several weeks. Unless buying pressure manages to push above key resistance levels, the current consolidation pattern could remain the dominant technical structure in the short term.
- MACD: The MACD histogram continues to fluctuate near the 0 neutral line, reflecting a relatively balanced dynamic within short-term moving averages. This suggests that the broader phase of neutrality has not completely disappeared from the chart.
- RSI: A different signal can be observed in the RSI, whose line has started to develop a positive slope above the 50 neutral level. This reflects that buying momentum has become increasingly relevant in recent sessions and could continue supporting a more consistent bullish bias if the current trend remains intact.
Key Levels:
- 158.78 – Key Resistance: A highly relevant level that coincides with the 200-period simple moving average and the most important short-term upside barrier. Price action consolidating above this area could favor a meaningful shift in the current market structure and begin establishing a pattern of higher highs, potentially creating room for the formation of a fresh bullish trendline in the weeks ahead.
- 157.81 – Near-Term Barrier: A level that coincides with the lower boundary of the recent trading range and also develops near the 50-period simple moving average. Price action returning toward this area could once again highlight a relatively neutral environment and reinforce the consolidation structure that has dominated recent weeks.
- 157.00 – Key Support: A low zone established during previous weeks that remains one of the most important downside barriers on the chart. Price action moving back toward this area could restore selling pressure and favor a more consistent bearish bias during the weeks ahead.
Written by Julian Pineda, CFA, CMT – Market Analyst
Follow him on: @julianpineda25