Key Events
- USDJPY faces resistance below 153.30, ahead of Wednesday’s FOMC meeting.
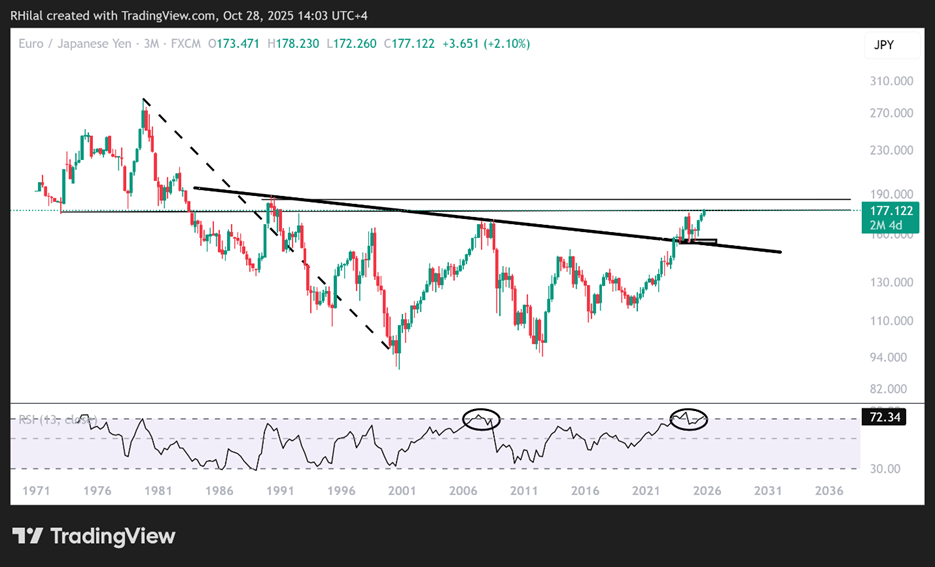
- EURJPY is testing highs last seen in 1990 near 178, alongside overbought signals last recorded in 2007.
- The BOJ monetary policy meeting, tentatively scheduled for Thursday, poses additional volatility risks for both uptrends.
EURJPY Outlook: 3-Month Time Frame – Log Scale
Source: Trading view
Given the steepness of EURJPY’s surge, the 3-month time frame is used to provide a clearer view of price action, showing a breakout beyond the long-term resistance connecting consecutive lows since 1990, and a retest of highs last seen that same year at 178.
- The RSI (14) is diverging from the price trend at overbought levels — last recorded in 2007 — amplifying pullback risks from current levels.
- The 178 mark also aligns with the 0.44 Fibonacci retracement of the 1979–2000 decline.
- A sustained close above this level could extend another leg higher toward 186, aligning with the 50% retracement and the 1990 peak.
On the downside, the previous 34-year resistance, now turned support, helps quantify the potential magnitude of a major pullback. A long term bullish bias remains valid as long as prices hold above this support; however, a bearish bias would emerge if prices close back below it — around the 154 mark.
Short-term levels are defined in the 3-day chart below.
EURJPY Outlook: 3-Day Time Frame – Log Scale
Source: Trading view
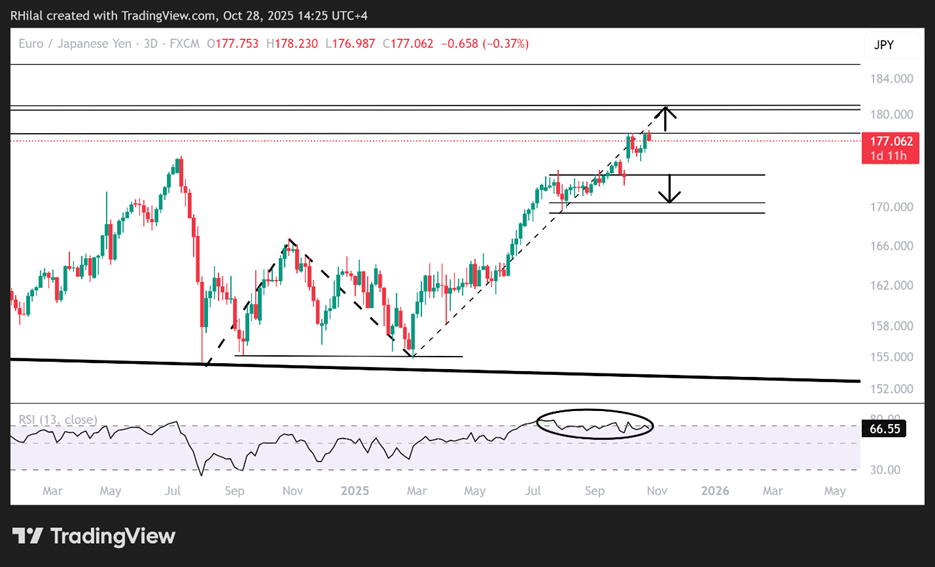
From a 3-day perspective, price action has extended from August 2024’s oversold conditions to overbought momentum last seen in July 2024, showing RSI divergence and hinting at pullback risks.
This may signal the potential formation of a double-top pattern around 178, as prices have rejected that level for the second time. A confirmed hold below 174.90 may strengthen the reversal pattern bias, with further losses extending toward 172.30 and 169.00.
In more extreme cases, downside targets could reach 165, 162, and 158, defining either a bullish hold above the 34-year trendline, or a breakdown below it.
On the upside, a clean break above the 178-resistance could extend gains toward 181, and in extreme cases, 185.
USDJPY Outlook: 3-Day Time Frame – Log Scale
Source: Tradingview
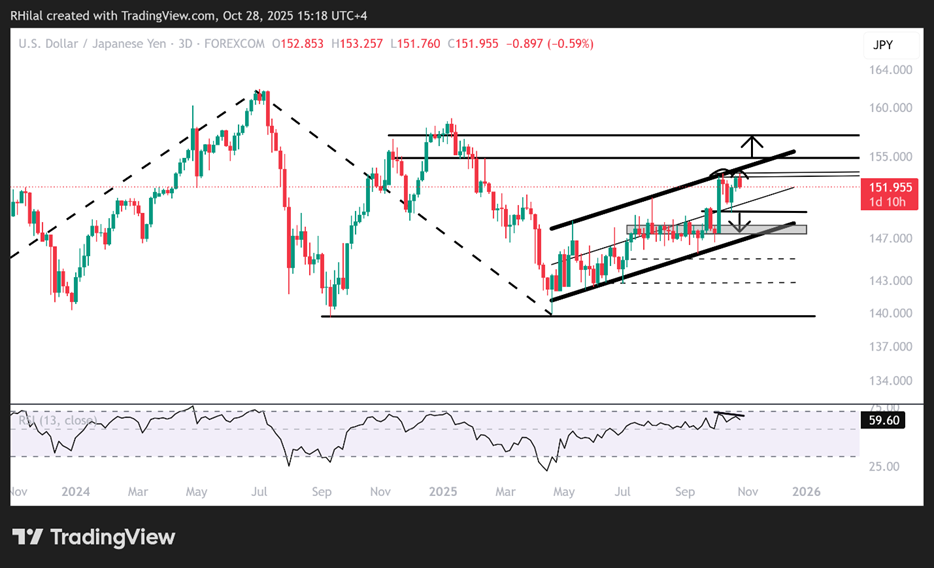
Similar to EURJPY, the USDJPY is also showing double-top risks below the 153.30 level, which has been rejected twice — creating two distinct scenarios.
- 153.30 Resistance:
Strong resistance defining two pullbacks, aligning with the upper boundary of a channel respected since April 2025. A sustained break above this level could drive gains toward yearly highs near 157, before confirming another leg higher. However, bearish RSI divergence from overbought levels last seen in January signals the risk of a potential pullback. - Downside Scenario:
If the decline continues and closes below 149.50, a double-top pattern may be confirmed, extending losses toward the lower boundary of the channel near 148.50 and 147.40.
These levels represent the dividing line between a bullish bias (above 150) and a bearish pullback toward yearly lows.
Written by Razan Hilal, CMT
Follow on X: @Rh_waves