






A Look at DXY before the FOMC
Overall, the DXY has been in a slight uptrending channel since June 2018.
Share this:

As mentioned in our Fed Preview, today the Fed is expected to cut rates by 25bps. If the Fed does indeed cut rates as expected, the markets will be focused on the FOMC statement and the Dot plots, which indicates their future projections of both interest rates and inflation. Let’s take a look at the US Dollar Index and the possibilities of where price may go, given a hawkish or dovish overall statement and projections. For reference, price of the DXY at the time of this writing is 98.33.
Overall, the DXY has been in a slight uptrending channel since June 2018. However, over the last week, trading was choppy to say the least! The daily candlestick chart really gives no clear direction the next short-term move.
Source: Tradingview, City Index
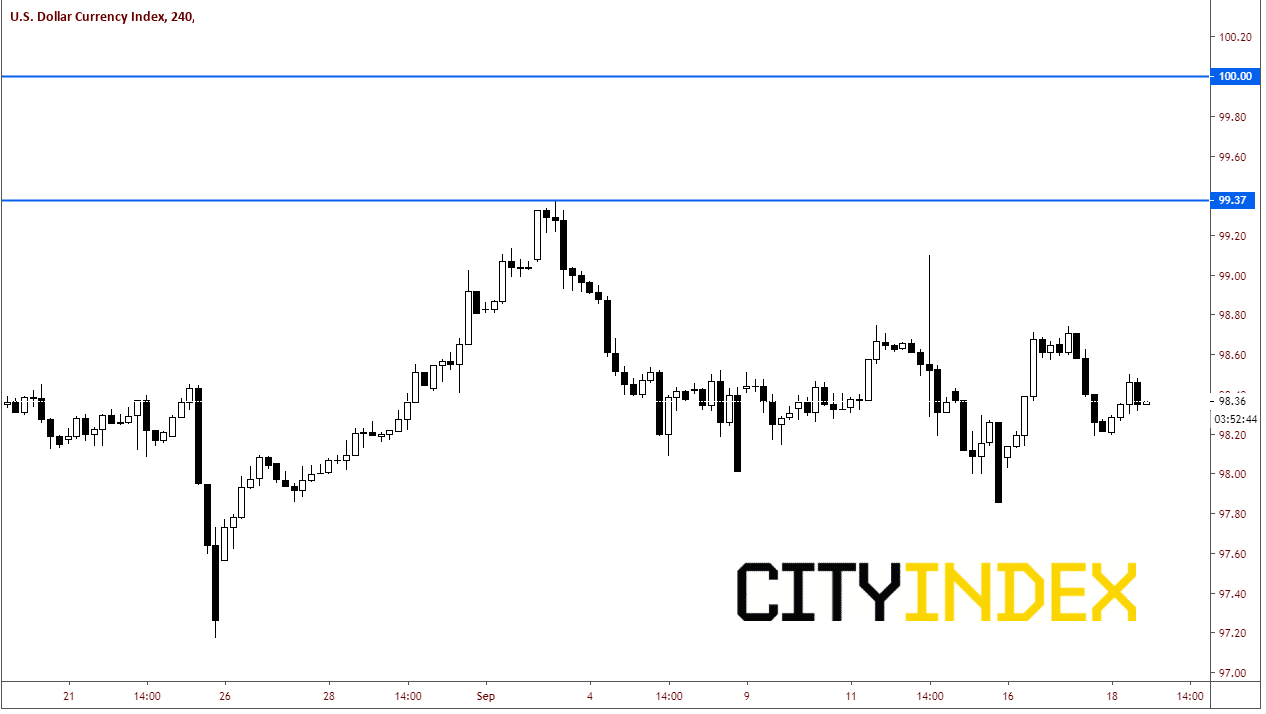
If the Fed were to have an overall hawkish view, the DXY could move higher. In this case there really isn’t much resistance until the highs of September 3rd at 99.37. Next resistance level would be the upper trendline of the daily channel at 99.56 (see previous daily chart). Third resistance is the psychological round number of 100.00.
Source: Tradingview, City Index
On the other hand, if the FED were to have an overall dovish view going forward, DXY could move lower. If this were to be the case, first support is horizontal support at 97.72. Next level be the support zone, which is made up of the lows from August 9th (97.03) and August 23rd (97.17). Third resistance is the lower trendline of the daily channel near 96.58 (see daily chart above).
Source: Tradingview, City Index
Of course, there is always an option for the Fed to remain neutral. In this case, expect more choppy trading until the next we get our next catalyst.
As always, make sure to keep an eye out for any “tweets” from President Trump after the Fed meeting, which also could move the US Dollar.
As mentioned in our Fed Preview, today the Fed is expected to cut rates by 25bps. If the Fed does indeed cut rates as expected, the markets will be focused on the FOMC statement and the Dot plots, which indicates their future projections of both interest rates and inflation. Let’s take a look at the US Dollar Index and the possibilities of where price may go, given a hawkish or dovish overall statement and projections. For reference, price of the DXY at the time of this writing is 98.33.
Overall, the DXY has been in a slight uptrending channel since June 2018. However, over the last week, trading was choppy to say the least! The daily candlestick chart really gives no clear direction the next short-term move.
Source: Tradingview, FOREX.com
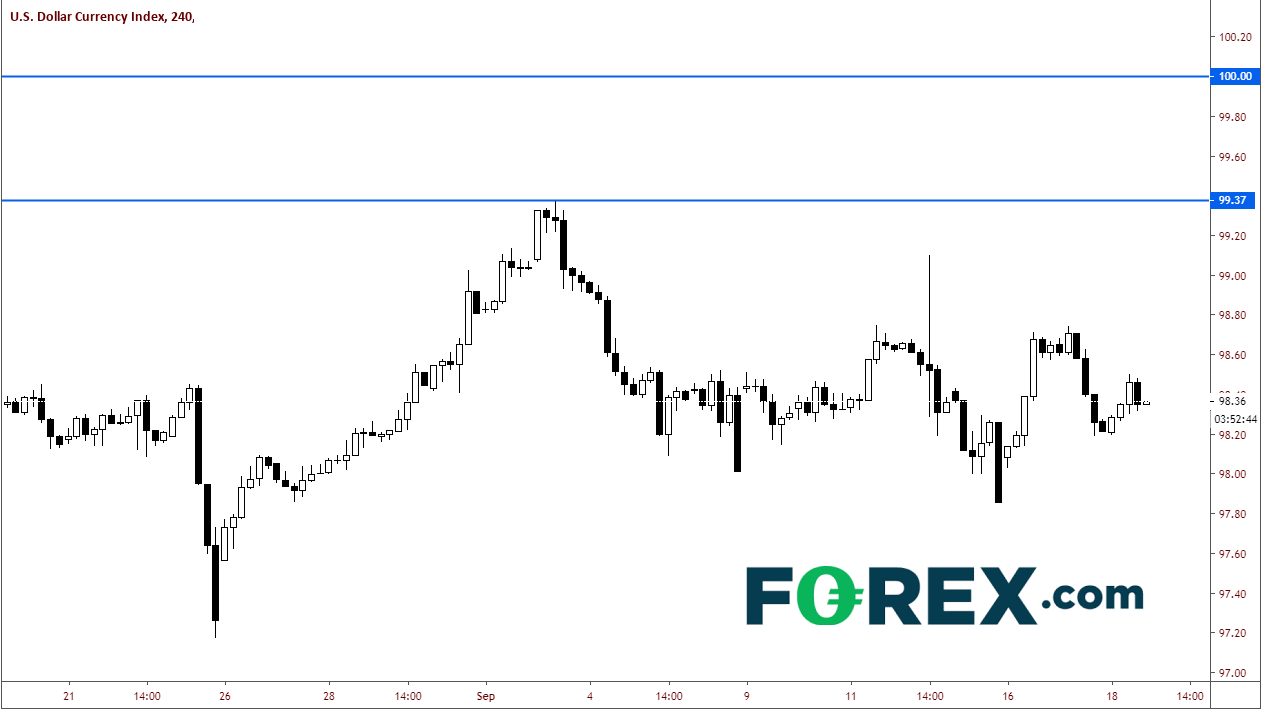
If the Fed were to have an overall hawkish view, the DXY could move higher. In this case there really isn’t much resistance until the highs of September 3rd at 99.37. Next resistance level would be the upper trendline of the daily channel at 99.56 (see previous daily chart). Third resistance is the psychological round number of 100.00.
Source: Tradingview, FOREX.com
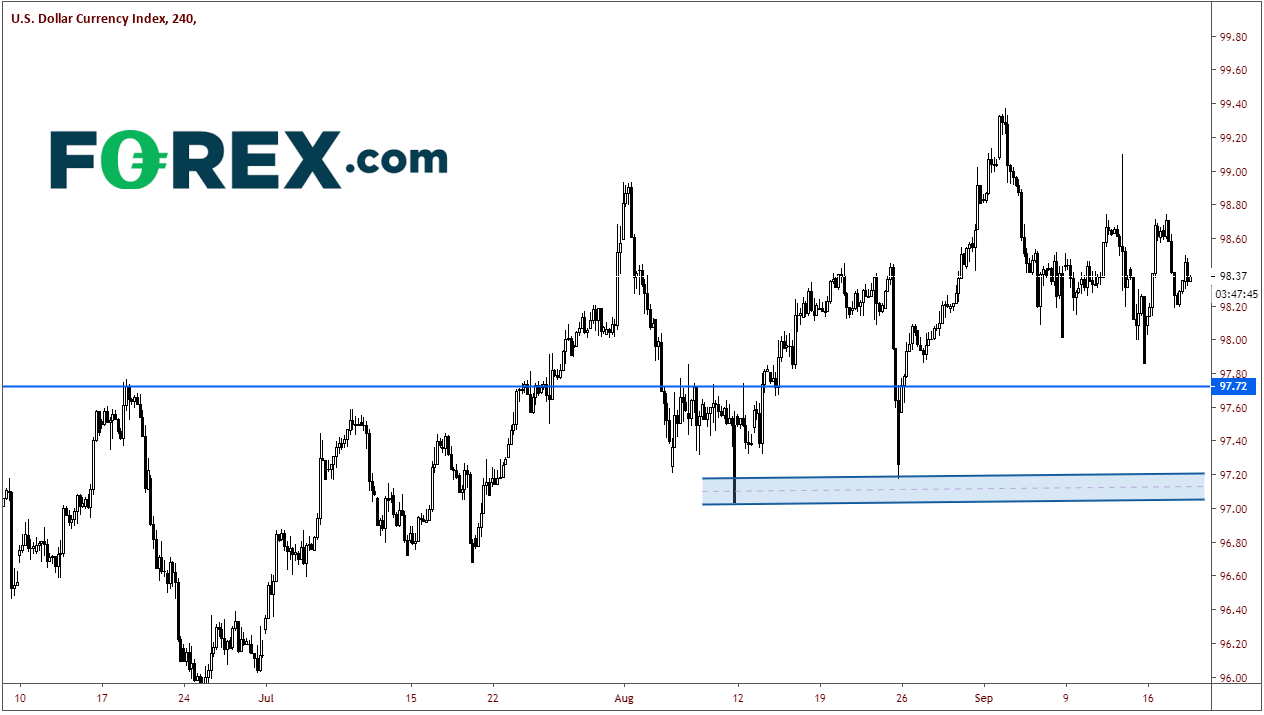
On the other hand, if the FED were to have an overall dovish view going forward, DXY could move lower. If this were to be the case, first support is horizontal support at 97.72. Next level be the support zone, which is made up of the lows from August 9th (97.03) and August 23rd (97.17). Third resistance is the lower trendline of the daily channel near 96.58 (see daily chart above).
Source: Tradingview, FOREX.com
Of course, there is always an option for the Fed to remain neutral. In this case, expect more choppy trading until the next we get our next catalyst.
As always, make sure to keep an eye out for any “tweets” from President Trump after the Fed meeting, which also could move the US Dollar.
Related tags:


The complete CFD trading experience
Award-winning platforms, competitive spreads, low commissions and dedicated support.
We live and breathe the markets and are dedicated to helping traders realise their ambitions as we continue to set the industry bar.
Economic calendar
Web Trader platform
Our sophisticated web-based platform is packed with features.
Related articles
USD/MXN Forecast: Peso Loses Momentum Ahead of Banxico Decision
Over recent trading sessions, the Mexican peso has started to show signs of losing strength against the U.S. dollar. This can be seen in the performance of USD/MXN, which has gained more than 1.7% over the last three sessions, highlighting the dollar's renewed strength against the peso.

Euro Short-term Outlook: EUR/USD Selloff Nears Critical Yearly Support 9 23 2026
Euro has fallen seven of the past nine sessions, with stretched momentum raising the stakes as EUR/USD closes in on a major inflection zone.


GBP/USD forecast: US dollar surges as bonds implode
The US dollar continued to press higher deep into the European session, supported by the slump in the bond markets as yields broke out across the curve. Following the recent hawkish Fed rate hike, yield spreads between the US and the rest of the world has continually increased, and that motion continued today, helped in part by some forecast-beating US macro data and hawkish Fed commentary.

StoneX Europe Ltd may make third party material available on this website which may contain information included but not limited to the conditions of financial markets. The material is for information purposes only and does not contain, and should not be construed as containing, investment advice and/or investment recommendation and/or an investment research and/or an offer of or solicitation for any transactions in financial instruments; any decision to enter into a specific transaction shall be made by the client following an assessment by him/her of their situation.
StoneX Europe Ltd makes no representation or warranty and assumes no liability as to the accuracy or completeness of the information provided, nor any loss arising from any investment based on a recommendation, forecast or other information supplied. You should always seek independent advice as to your suitability to speculate in any related markets and your ability to assume the associated risks, if you are at all unsure. We are not under any obligation to update any such material. Any opinion made may be personal to the author and may not reflect the opinion of StoneX Europe Ltd.