






A Risk Reversal Could Finally Be Underway
The table could be turning for risk, with several JPY crosses looking like they’re finally topping out and due their anticipated corrections.
Share this:

The table could be turning for risk, with several JPY crosses looking like they’re finally topping out and due their anticipated corrections. With indices just off record highs and several markets pausing below key resistance (AUD/USD, EUR/JPY and USD/JPY, just to name a few), it suggests traders are hopeful US and China can sign this famous deal, yet doubts linger in the air. And with reports piling up that US and China aren’t likely to sign the famous “phase one” trade deal until December, then risk could be ripe for a correction. And this potential correction was flagged a couple of weeks ago with so many markets pausing at the said key levels. Now momentum has turned, the probability of downside for risk assets could be increasing, although equity markets are yet to play catch up.
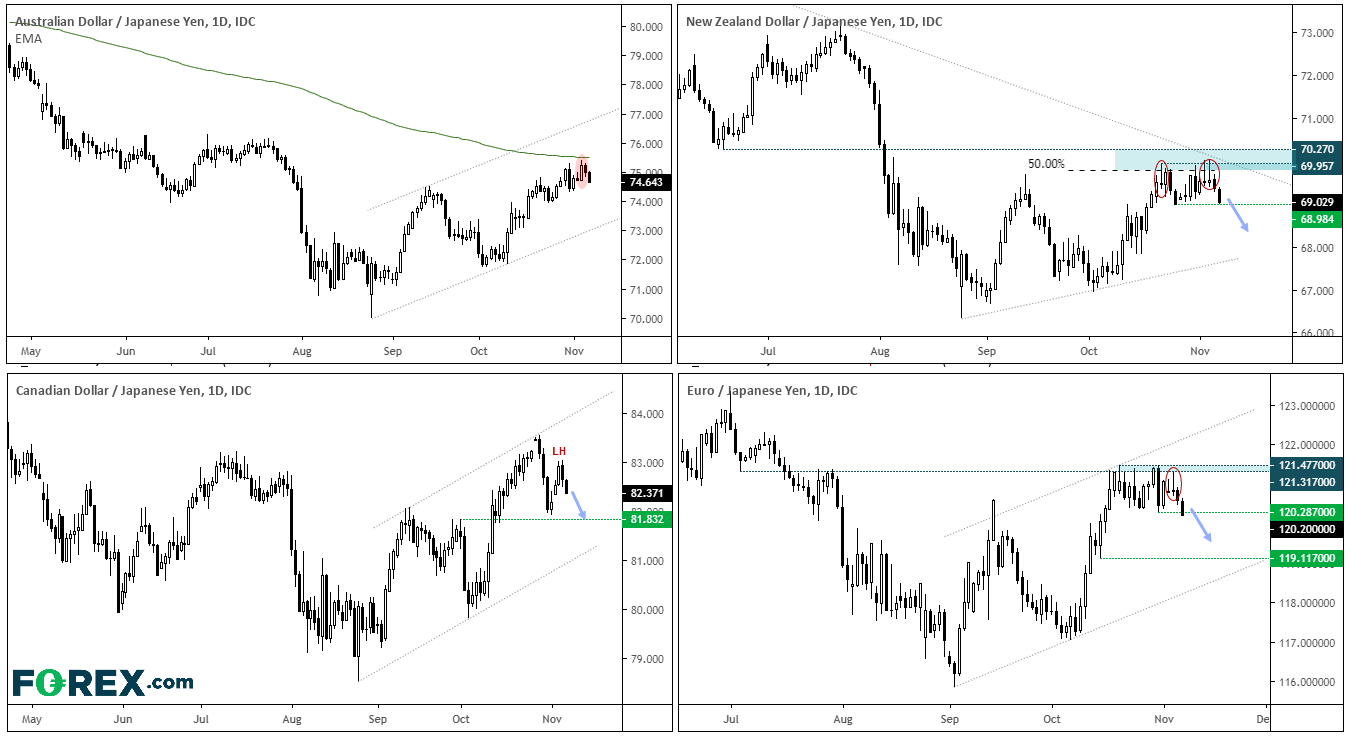
- AUD/JPY: A 2-bar reversal formed below the 200-day eMA. We outlined potential resistance following New Zealand’s weak employment data and it looks like a correction is underway. That said, we it appears NZD/JPY may provide better downside potential.
- NZDJPY: A series of bearish pinbars stalled near the resistance cluster and beneath the bearish trendline. Moreover, price action has carved out a double top. Bearish momentum picked up at the end of the US session and carried through to Asia, and now on the cusp of breaking key support. Bears could target the lows around 68 and/or the lower trendline.
- CAD/JPY: One of the stronger performers against the since the August lows, price action reversed after perfectly hitting the upper bounds of the channel. A lower high has formed with a dark cloud cover and prices are now trying to make their way to 81.83 support. If this level breaks, the lower trendline becomes the focus for bears.
- EUR/JPY: has broken out of its 100-pip range to the downside after printing a bearish pinbar beneath resistance. Given the resurgence of dollar strength, EUR/JPY may be more appealing to bears than USD/JPY.
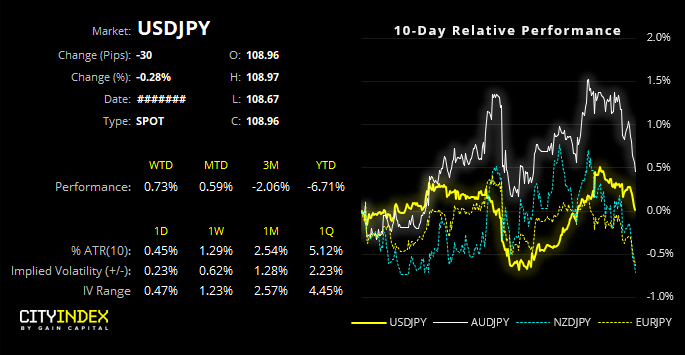
109.32 is clearly a big level for USD/JPY as its tired and failed to break this level three times. The Elongated bearish engulfing candle marked prominent resistance on the 1st August and prices rolled over to print a fresh YTD low. Whilst a recovery saw it recoup losses, a bearish pinbar reaffirmed the key resistance levels, and prices have retreated from it once more with a bearish Harammi pattern today.
We could go as far to say that 109.32 could be the ‘phase one’ line in the sand so, without a deal, its hard to envisage a bullish breakout yet. Yet if we stand back there is the potential for a larger bearish wedge formation.
- If successful, the bearish wedge projects a target near its base around 104.50. Bears could use a break of the bullish trendline, and target swing lows. However, we’d typically want to see direct losses out of such patterns (as it should be an impulsive move). So if the breakout lacks momentum, the probability of a failed pattern theoretically increases.
- Bulls could wait for a break above 109.31. However, we’d want to see this done with decent momentum, otherwise it could just be the bearish wedge carving out another high. Obviously, we’d want to see risk-on generally for a bullish breakout which would require broad yen weakness, higher equities and yields.
Related analysis:
EUR/JPY Coiling for a Breakout?
Is A ‘Risk Reversal’ On The Cards? | SPX, NDX, Yen
Expectations, Forward Returns And Some Charts! | USD/JPY, EUR/JPY, NZD/JPY
The table could be turning for risk, with several JPY crosses looking like they’re finally topping out and due their anticipated corrections. With indices just off record highs and several markets pausing below key resistance (AUD/USD, EUR/JPY and USD/JPY, just to name a few), it suggests traders are hopeful US and China can sign this famous deal, yet doubts linger in the air. And with reports piling up that US and China aren’t likely to sign the famous “phase one” trade deal until December, then risk could be ripe for a correction. And this potential correction was flagged a couple of weeks ago with so many markets pausing at the said key levels. Now momentum has turned, the probability of downside for risk assets could be increasing, although equity markets are yet to play catch up.
- AUD/JPY: A 2-bar reversal formed below the 200-day eMA. We outlined potential resistance following New Zealand’s weak employment data and it looks like a correction is underway. That said, we it appears NZD/JPY may provide better downside potential.
- NZDJPY: A series of bearish pinbars stalled near the resistance cluster and beneath the bearish trendline. Moreover, price action has carved out a double top. Bearish momentum picked up at the end of the US session and carried through to Asia, and now on the cusp of breaking key support. Bears could target the lows around 68 and/or the lower trendline.
- CAD/JPY: One of the stronger performers against the since the August lows, price action reversed after perfectly hitting the upper bounds of the channel. A lower high has formed with a dark cloud cover and prices are now trying to make their way to 81.83 support. If this level breaks, the lower trendline becomes the focus for bears.
- EUR/JPY: has broken out of its 100-pip range to the downside after printing a bearish pinbar beneath resistance. Given the resurgence of dollar strength, EUR/JPY may be more appealing to bears than USD/JPY.
109.32 is clearly a big level for USD/JPY as its tired and failed to break this level three times. The Elongated bearish engulfing candle marked prominent resistance on the 1st August and prices rolled over to print a fresh YTD low. Whilst a recovery saw it recoup losses, a bearish pinbar reaffirmed the key resistance levels, and prices have retreated from it once more with a bearish Harammi pattern today.
We could go as far to say that 109.32 could be the ‘phase one’ line in the sand so, without a deal, its hard to envisage a bullish breakout yet. Yet if we stand back there is the potential for a larger bearish wedge formation.
- If successful, the bearish wedge projects a target near its base around 104.50. Bears could use a break of the bullish trendline, and target swing lows. However, we’d typically want to see direct losses out of such patterns (as it should be an impulsive move). So if the breakout lacks momentum, the probability of a failed pattern theoretically increases.
- Bulls could wait for a break above 109.31. However, we’d want to see this done with decent momentum, otherwise it could just be the bearish wedge carving out another high. Obviously, we’d want to see risk-on generally for a bullish breakout which would require broad yen weakness, higher equities and yields.
Related analysis:
EUR/JPY Coiling for a Breakout?
Is A ‘Risk Reversal’ On The Cards? | SPX, NDX, Yen
Expectations, Forward Returns And Some Charts! | USD/JPY, EUR/JPY, NZD/JPY
Latest market news




The complete CFD trading experience
Award-winning platforms, competitive spreads, low commissions and dedicated support.
We live and breathe the markets and are dedicated to helping traders realise their ambitions as we continue to set the industry bar.
Economic calendar
Web Trader platform
Our sophisticated web-based platform is packed with features.
Related articles
USD/JPY Q4 2026 Outlook: Hawkish Fed Pricing Clashes With Intervention Risk
The year-end tug-of-war is clear: hawkish Fed pricing supports USD/JPY, while intervention risk limits the upside.
Japanese Yen Forecast: USD/JPY 4% Rally Challenges Post-Intervention Downtrend 9 24 2026
USD/JPY momentum has shifted sharply higher, putting a major resistance confluence in focus as U.S. and Japanese event risk builds.


Oil Quietly Hands the Fed a Reason to Stay Hawkish
Oil prices and the U.S. dollar are both on the front foot as elevated energy costs feed Fed warnings that inflation may prove sticky.

StoneX Europe Ltd may make third party material available on this website which may contain information included but not limited to the conditions of financial markets. The material is for information purposes only and does not contain, and should not be construed as containing, investment advice and/or investment recommendation and/or an investment research and/or an offer of or solicitation for any transactions in financial instruments; any decision to enter into a specific transaction shall be made by the client following an assessment by him/her of their situation.
StoneX Europe Ltd makes no representation or warranty and assumes no liability as to the accuracy or completeness of the information provided, nor any loss arising from any investment based on a recommendation, forecast or other information supplied. You should always seek independent advice as to your suitability to speculate in any related markets and your ability to assume the associated risks, if you are at all unsure. We are not under any obligation to update any such material. Any opinion made may be personal to the author and may not reflect the opinion of StoneX Europe Ltd.