



Antipodean double header next test for AUDNZD
With the dust still settling on last night’s red-hot U.S inflation data, attention locally will turn to an Antipodean doubleheader tomorrow in the shape of Q2 NZ GDP and the Australian August labour force report.
Share this:
With the dust still settling on last night’s red-hot U.S inflation data, attention locally will turn to an Antipodean doubleheader tomorrow in the shape of Q2 NZ GDP and the Australian August labour force report.
While neither of the data points is likely to cause the magnitude of reaction seen today, both have a role to play in the narrative around the speed of policy tightening by the RBNZ and RBA.
As well as having a say on whether AUDNZD currently trading at almost five-year highs can continue higher.
Q2 New Zealand GDP data is due to drop at 8.45 am Sydney time. Following a 0.2% contraction in Q1 as Omicron ripped through the country, the reopening of international borders that has seen the resumption of overseas tourists and students is expected to see a 1.6% rise in Q2.
Despite the rapid cooling in the housing market, high inflation is expected to see the RBNZ continue to hike rates from 3% to 3.75% by November.
The Australian labour force report for August, due at 11.30 am Sydney time tomorrow, is expected to see a 50k rise in employment and for the unemployment rate to hold at a record low of 3.4%, and the participation rate to rise to 66.7%.
The strong jobs market was likely behind a lift in consumer confidence yesterday and supported by lower petrol prices and the shock value of aggressive RBA rate hikes wearing off.
In this case, there is no reason for the RBA not to continue tightening further into the restrictive territory into yearend to tame spiralling inflation and to cool a tight labour market. The market sees the cash rate ending the year near 3.35%.
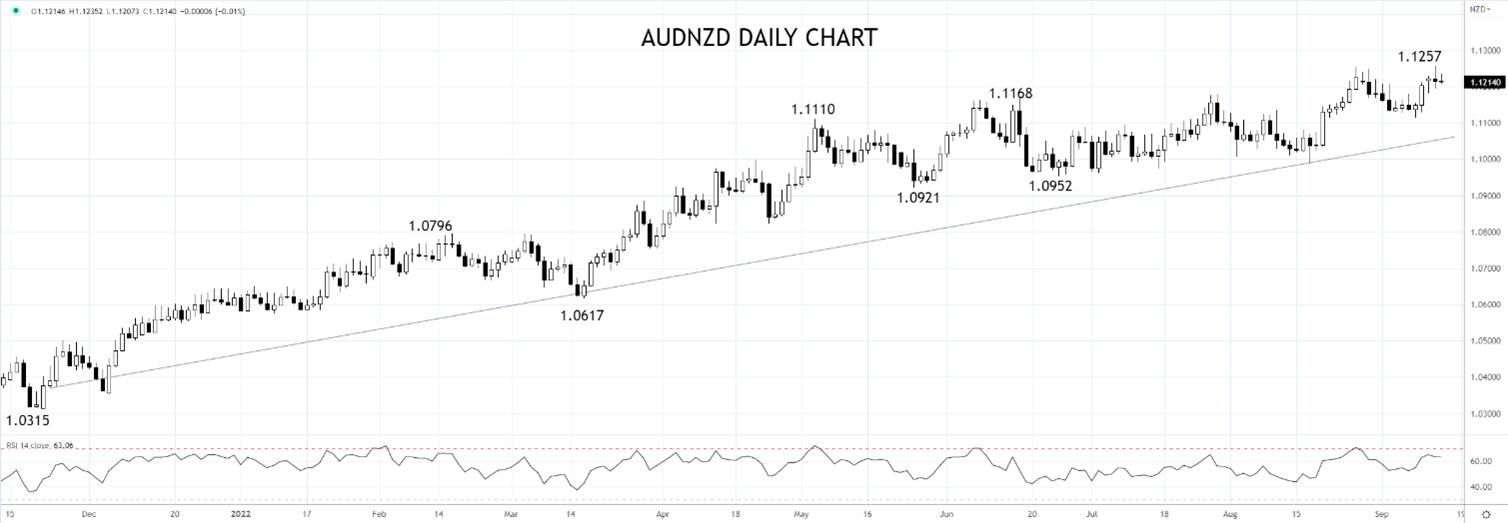
Turning to the cross rate, AUDNZD is currently eyeing the 1.1290 high of 2017, supported by buoyant energy and commodity prices, which have kept Australia’s Terms of Trade at record highs despite the slow down in China.
While the rally does look a little overbought in the short term, should AUDNZD see a sustained break of 1.1290, look for the rally to extend towards the August 2015 1.1472 high.
Source Tradingview. The figures stated are as of September 14th, 2022. Past performance is not a reliable indicator of future performance. This report does not contain and is not to be taken as containing any financial product advice or financial product recommendation
How to trade with City Index
You can trade with City Index by following these four easy steps:
- Open an account, or log in if you’re already a customer
• Open an account in the UK
• Open an account in Australia
• Open an account in Singapore
- Search for the company you want to trade in our award-winning platform
- Choose your position and size, and your stop and limit levels
- Place the trade
With the dust still settling on last night’s red-hot U.S inflation data, attention locally will turn to an Antipodean doubleheader tomorrow in the shape of Q2 NZ GDP and the Australian August labour force report.
While neither of the data points is likely to cause the magnitude of reaction seen today, both have a role to play in the narrative around the speed of policy tightening by the RBNZ and RBA.
As well as having a say on whether AUDNZD currently trading at almost five-year highs can continue higher.
Q2 New Zealand GDP data is due to drop at 8.45 am Sydney time. Following a 0.2% contraction in Q1 as Omicron ripped through the country, the reopening of international borders that has seen the resumption of overseas tourists and students is expected to see a 1.6% rise in Q2.
Despite the rapid cooling in the housing market, high inflation is expected to see the RBNZ continue to hike rates from 3% to 3.75% by November.
The Australian labour force report for August, due at 11.30 am Sydney time tomorrow, is expected to see a 50k rise in employment and for the unemployment rate to hold at a record low of 3.4%, and the participation rate to rise to 66.7%.
The strong jobs market was likely behind a lift in consumer confidence yesterday and supported by lower petrol prices and the shock value of aggressive RBA rate hikes wearing off.
In this case, there is no reason for the RBA not to continue tightening further into the restrictive territory into yearend to tame spiralling inflation and to cool a tight labour market. The market sees the cash rate ending the year near 3.35%.
Turning to the cross rate, AUDNZD is currently eyeing the 1.1290 high of 2017, supported by buoyant energy and commodity prices, which have kept Australia’s Terms of Trade at record highs despite the slow down in China.
While the rally does look a little overbought in the short term, should AUDNZD see a sustained break of 1.1290, look for the rally to extend towards the August 2015 1.1472 high.
Related tags:
Latest market news




The complete CFD trading experience
Award-winning platforms, competitive spreads, low commissions and dedicated support.
We live and breathe the markets and are dedicated to helping traders realise their ambitions as we continue to set the industry bar.
Economic calendar
Web Trader platform
Our sophisticated web-based platform is packed with features.
Related articles
Canadian Dollar Short-term Outlook: USD/CAD Five-Week Rally Hits a Wall at Major Resistance 10 14 2026
USD/CAD is holding near fresh yearly highs, but bearish divergence and a well-defined October range raise the stakes at major resistance.

EUR/USD Analysis: Euro Loses Ground After a Stronger-Than-Expected U.S. CPI Report
The trading week continues to unfold and weakness around the euro has once again become increasingly evident in the short term. This can be seen in the recent performance of EUR/USD, which has declined roughly 0.3% over the last three trading sessions, highlighting renewed strength in the U.S. dollar.

USD/JPY forecast: hot US CPI lifts the pair above its 200-day average
Hotter-than-expected US inflation has pushed USD/JPY above its 200-day moving average, putting 160 and the risk of Bank of Japan intervention back in focus. The breakout still needs to hold, and a failure could send the pair sharply lower.

StoneX Europe Ltd may make third party material available on this website which may contain information included but not limited to the conditions of financial markets. The material is for information purposes only and does not contain, and should not be construed as containing, investment advice and/or investment recommendation and/or an investment research and/or an offer of or solicitation for any transactions in financial instruments; any decision to enter into a specific transaction shall be made by the client following an assessment by him/her of their situation.
StoneX Europe Ltd makes no representation or warranty and assumes no liability as to the accuracy or completeness of the information provided, nor any loss arising from any investment based on a recommendation, forecast or other information supplied. You should always seek independent advice as to your suitability to speculate in any related markets and your ability to assume the associated risks, if you are at all unsure. We are not under any obligation to update any such material. Any opinion made may be personal to the author and may not reflect the opinion of StoneX Europe Ltd.