



USD Index, AUD/NZD Analysis: Asian Open – 19th July 2023
US yields are showing signs of stability alongside the US dollar, hinting at a potential corrective bounce. And, whilst NZ CI was hotter than liked, I doubt it will be enough for another RBNZ hike which leaves a potential setup on AUD/NZD.
Share this:

Market Summary:
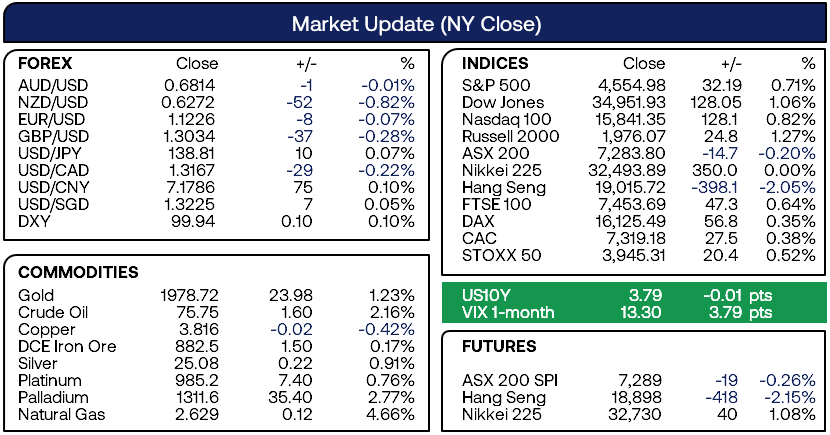
- Strong earnings reports by Bank of America (BOA) and Morgan Stanley (MS) supported baking stocks and the broader market, sending the S&P 500 to a fresh 15month high and the Nasdaq 100 to less than 60 points form 16k
- US retail sales rose in June but at a slower pace than expected to show consumers are still spending but not at such a hot pace, whilst industrial production contracted at a faster pace than expected
- Regardless, Fed Fund Futures now imply a 99.8% chance of a 25bp hike next week although back a pause in August with an 85.9% probability
- Canada’s inflation came in softer than expected and prompted hopes that the BOC may not hike again in September
- The rate of CPI fell to a 28-year low of 2.8% (3% forecast, 3.4% prior) or 0.1% m/m (0.3% forecast, 0.4% prior). Core CPI actually deflated by -0.1% m/m (0.5% expected, 0.4% prior) or 3.2% y/y (3.5% forecast, 3.7% prior)
- However, the devil is in the detail as the BOC’s preferred measures remained elevate, with the median and trimmed mean CPIs both beating expectations (median rose 3.9% versus y/y versus 3.7% expected and trimmed rose 3.7% versus 3.4% expected)
- RBA minutes reiterated that a pause was the stronger case of a 25bp hike, and that further tightening may be required depending on the incoming data
- NZ inflation was higher than expected at 1.1% q/q (1% forecast, 1.2% prior) and 6% y/y (5.9% forecast, 6.7% prior) which saw NZD pairs strengthen on bets the RBNZ may be forced to hike. Personally, I do not think today’s inflation report cements another hike given annual CPI is quite a bit lower than previously and the economy is within a recession.
Events in focus (AEDT):
- 16:00 – UK CPI
- 19:00 – EU CPI
- 22:30 – US building permits

Technically Speaking:
- AUD/USD failed to hold onto RBA gains and formed a Rikshaw Man Doji day above 68c, a level that appears to want to hold over the near-term
- EURUSD made a failed bid for 1.1300 that resulted in a bearish hammer on the daily chart and third indecision day in a row, to underscore its hesitancy to break higher and brings in the potential for a snapback to its mean
- AUD/JPY formed a daily bullish pinbar and its lower wick held just above Monday’s open price to show demand above 93.81, so we may be close or already at an inflection point for its next leg higher
- USD/CNH rose for a third day after finding support at the 50-day EMA on Friday, and the next level for bulls to conquer is yesterday’s high (around the 2019 and 2020 highs)
- WTI crude oil rallied from $74 support and shows the potential to break above $76, but we suggest traders keep an eye on the US dollar to make sure higher USD doesn’t cap WTI gains (see below)
- Gold posted strong gains yesterday in line with our bullish bias and stopped just shy of the 1980, handle, although prices may consolidate or pullback form the 1980 – 1985 region
ASX 200 at a glance:
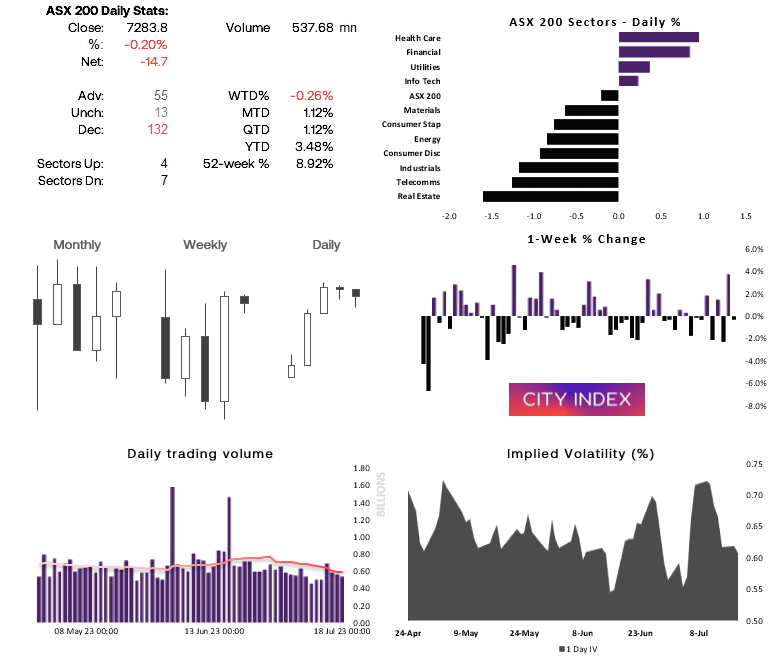
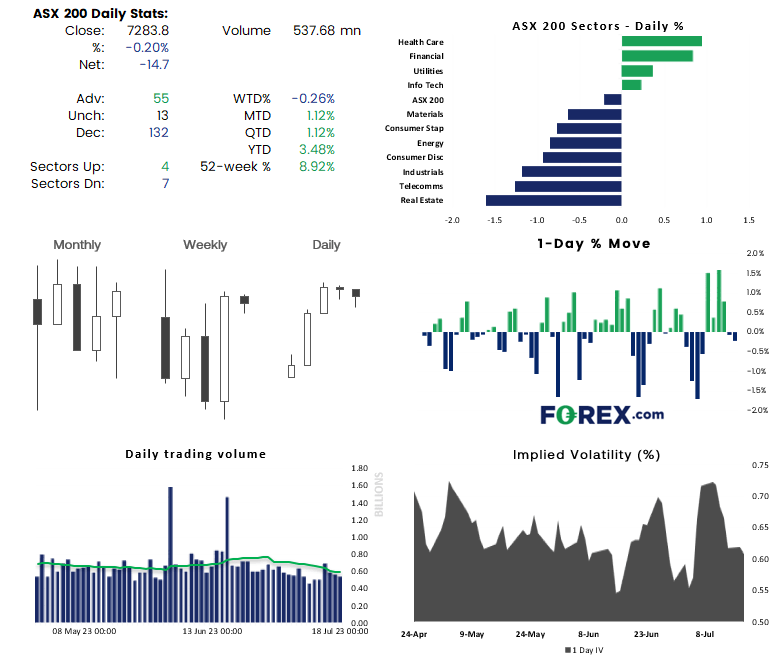
- The ASX 200 retraced lower for a second day following the release of the RBA minutes, although the daily range of the past two days have been the lowest this month
- But we should also monitor the performance of the S&P 500 which sits near its 15-month high, as a retracement on the ASX likely requires a pullback on US indices
- We outlined a bias for the ASX 200 to retrace towards 7200 whilst prices remain beneath last week’s high in yesterday’s European Open report
- If US indices continue to rally, this could provide further support for the ASX 200 but we would have to question the reward to risk potential for bulls with resistance levels at 7300, 7315 and 7368
US dollar index daily chart:
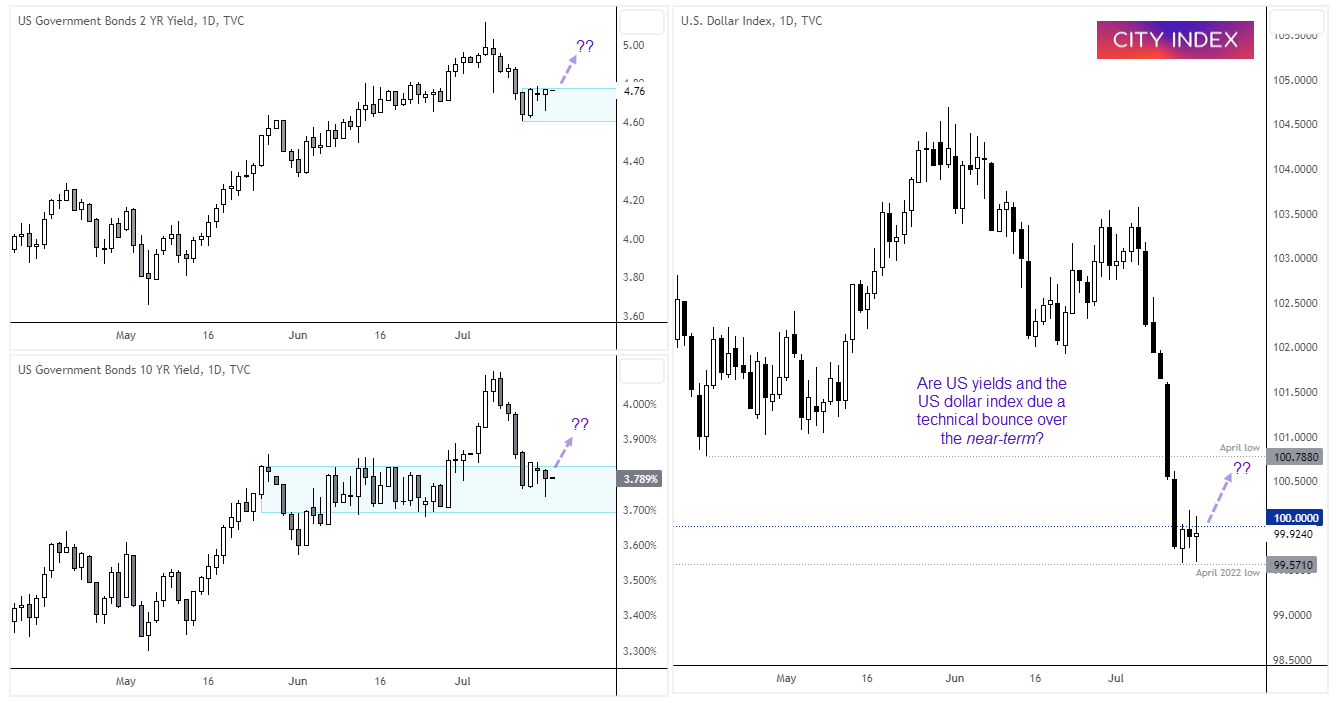
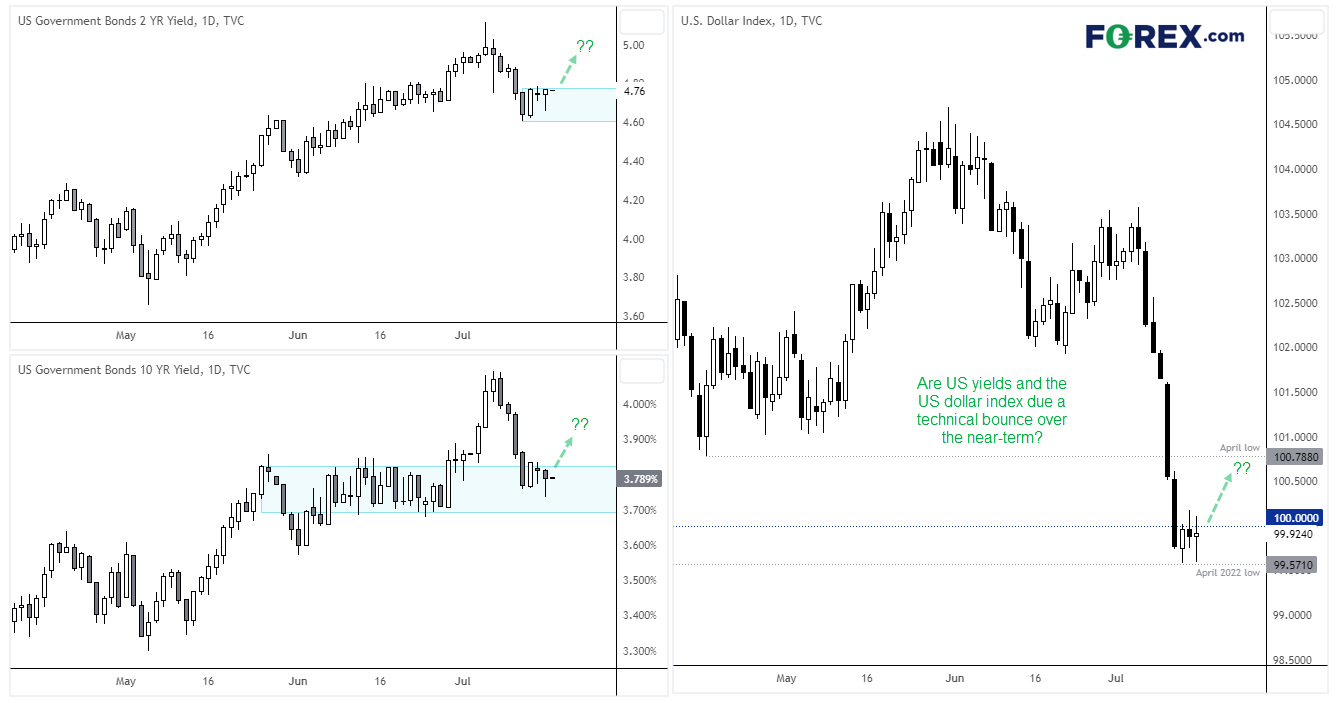
The downside potential for the US dollar looks increasingly risky for bears over the near-term, given the US dollar index is failing to see a bearish follow through since breaking beneath 100. Furthermore, US yields are showing signs of stability alongside the potential for a pop higher. The 2-year yield – which is more sensitive to monetary policy – produced a bullish engulfing candle on Friday above 2.6% and prices have closed in the top quarter half of the candle’s range since. The US 10-year yield also looks comfortable above 3.7% and holds a above a prior consolidation area, where a lot of volumes generally reside. And with the US dollar index finding support at the April 2022 high and printing a double bottom with a Doji, perhaps the next move for the greenback is higher and for a move towards 100.5 or the April low at 100.78 as part of a technical retracement against strong losses.
AUD/NZD daily chart:
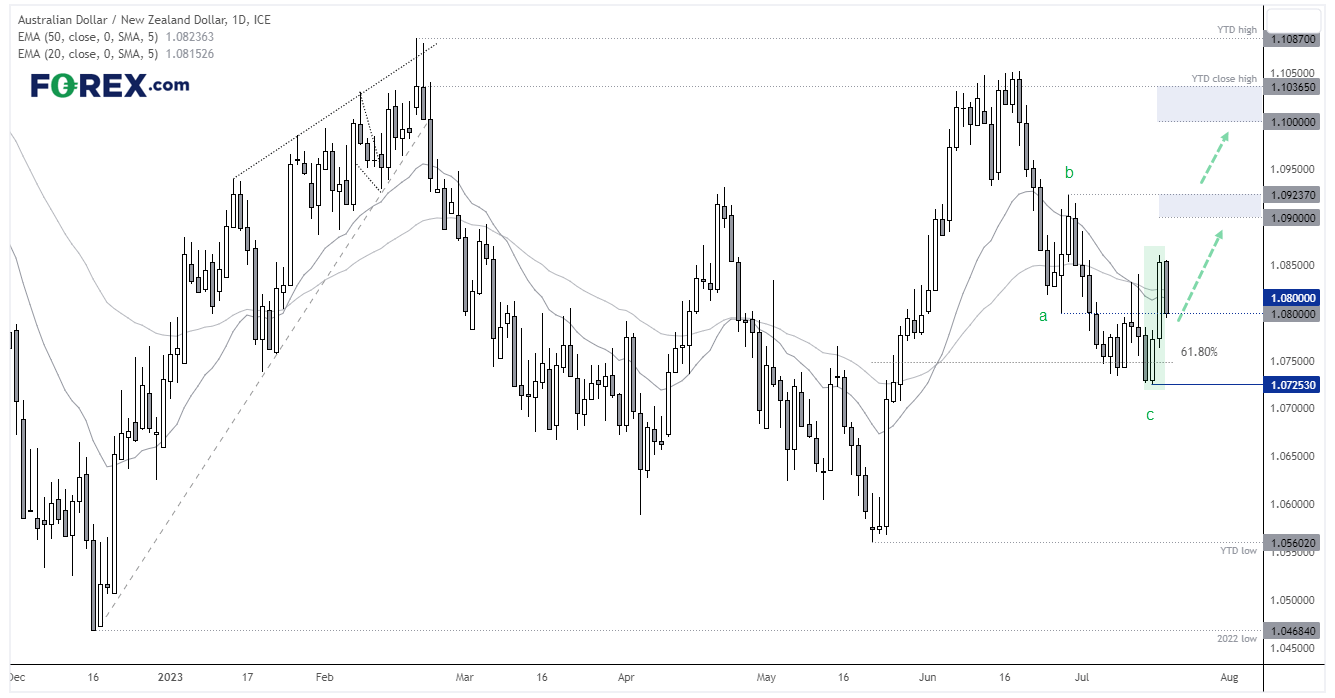
Last week we outlined a bullish bias on AUD/NZD following RBNZ’s decision to pause and likely hold rates at 5.5%, based on expectations that the RBNZ-RBA cash rate will diminish over the coming months. Yesterday’s RBA minutes appears to be the trigger for a strong rally and marks 1.0725 as an important swing low. The cross also closed above the 20, 50 and 200-day EMAs.
Whilst today’s NZ CPI report was hotter than expected, it is still quite a lot lower than previously and may not necessarily mean the RBNZ will hike (given they are in a recession). Therefore, we see the pullback to the 1.0800 area as a potential gift for bulls.
1.0900 and 1.1000 handles now make suitable targets for bulls, with the bigger question being if a deeper pullback is warranted (which could improve the potential reward to risk ratio), or head higher in a more direct fashion from the 1.0800 area. A break below 1.07250 invalidates the bullish bias.

-- Written by Matt Simpson
Follow Matt on Twitter @cLeverEdge
How to trade with City Index
You can trade with City Index by following these four easy steps:
- Open an account, or log in if you’re already a customer
• Open an account in the UK
• Open an account in Australia
• Open an account in Singapore
- Search for the market you want to trade in our award-winning platform
- Choose your position and size, and your stop and limit levels
- Place the trade
Related tags:



The complete CFD trading experience
Award-winning platforms, competitive spreads, low commissions and dedicated support.
We live and breathe the markets and are dedicated to helping traders realise their ambitions as we continue to set the industry bar.
Economic calendar
Web Trader platform
Our sophisticated web-based platform is packed with features.
Related articles

AUD/USD forecast: Currency Pair of the Week | September 28, 2026
The week has started with stocks, gold, silver and bitcoin all falling, as crude oil rebounded and bond yields pushed further higher. Trump refusing to agree to Tehran’s proposal to re-open the Strait of Hormuz has left the markets disappointed. Still, reports that mediators are expected to hold talks with the two sides on an amended version of the 7-day proposal that Iran presented, keeps hopes alive that we may see some progress.


Gold Outlook: XAU/USD hit hard as US yields, dollar resume ascent
A stronger dollar, surging front-end yields and renewed geopolitical tension have combined to push gold back towards key technical support.


EUR/USD weekly outlook: Oil, inflation and NFP in focus
After coming under significant pressure in recent weeks, the EUR/USD came off its lows to finish the week on a positive note on Friday, albeit with only a mild rebound. That was not enough to prevent the exchange rate falling for the third consecutive week, as the US dollar and bond yields rallied across the board.
StoneX Europe Ltd may make third party material available on this website which may contain information included but not limited to the conditions of financial markets. The material is for information purposes only and does not contain, and should not be construed as containing, investment advice and/or investment recommendation and/or an investment research and/or an offer of or solicitation for any transactions in financial instruments; any decision to enter into a specific transaction shall be made by the client following an assessment by him/her of their situation.
StoneX Europe Ltd makes no representation or warranty and assumes no liability as to the accuracy or completeness of the information provided, nor any loss arising from any investment based on a recommendation, forecast or other information supplied. You should always seek independent advice as to your suitability to speculate in any related markets and your ability to assume the associated risks, if you are at all unsure. We are not under any obligation to update any such material. Any opinion made may be personal to the author and may not reflect the opinion of StoneX Europe Ltd.