





ASX200 Mean Reversion Could Be Underway
We’ve been monitoring the potential for an inflection point on the ASX200 for the past couple of weeks and it appears cracks are now appearing at recent highs.
Share this:

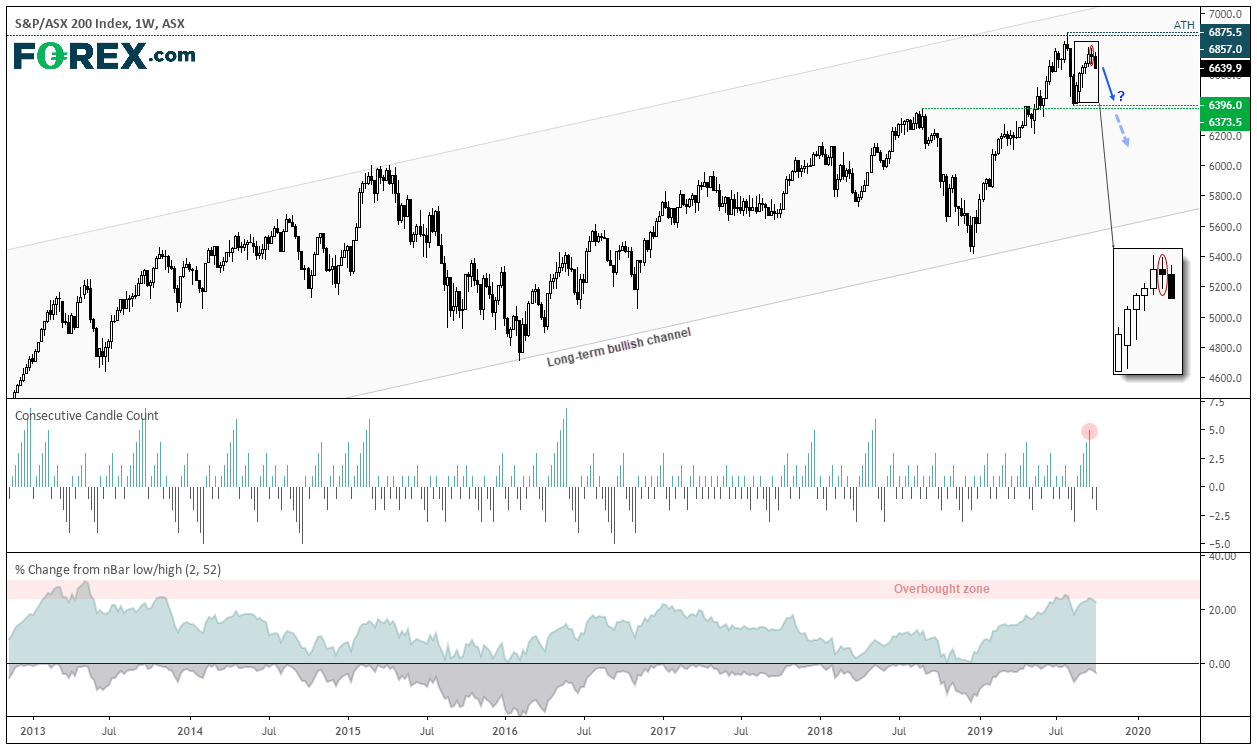
We’ve been monitoring the potential for an inflection point on the ASX200 for the past couple of weeks and it appears cracks are now appearing at recent highs. There’s no denying it remains within a long-term uptrend trend on the weekly chart, as it trades within an established bullish channel. Yet this channel allows for some large swings, and a lower high in September is just one clue that the downside beckons.
The lower indicator measures the % distance from its 52-week high or low. Historically, rallies around 25-30% from the 52-week low have triggered a sizable correction, a threshold which was achieved at this year’s high. Furthermore, five bullish weeks were seen ahead of a spinning top doji and, itself a candidate for a swing high. As price action has now breached the doji low, it further suggests a top is in on the weekly chart.
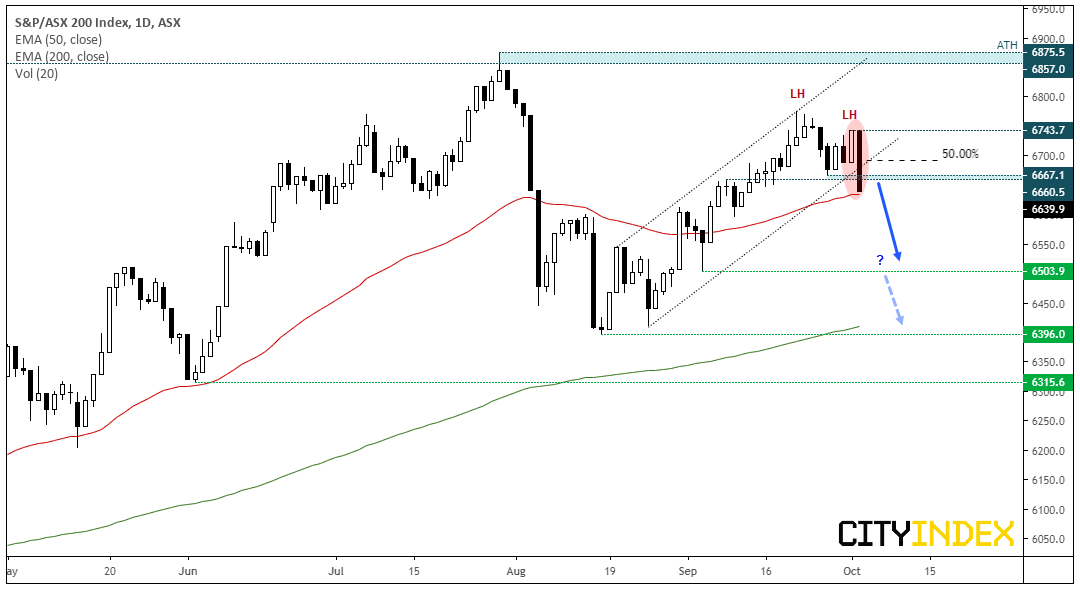
Switching to the daily chart has seen a bearish break of a bullish channel. And not only was this bearish outside day its worst session in 7-weeks, but it opened at the high and closed at the low to produce a bearish Marabuzo candle. One method to use such elongated candles is to simply measure the 50% of its range to use as an invalidation point if it is crossed. And yesterday’s candle has also formed a lower high ahead of the breakout.
- Whilst prices closed beneath 6,660 support, the 50-day average is providing support for now.
- Given the bearish clues overall, we remain bearish on the daily chart below 6743.7. However, the 50% Marabuzo line can be used to invalidate the bias, if a more aggressive approach is preferred.
- A break beneath the 50-day eMA could suggest the downside is to continue, and bears could target the base of the channel just above the 6,400 and use 6,500 as an interim target.
- Due to the mean reversion potential of the weekly chart, we’ll continue to monitor its potential for a much larger breakdown as price action unfolds.
We’ve been monitoring the potential for an inflection point on the ASX200 for the past couple of weeks and it appears cracks are now appearing at recent highs. There’s no denying it remains within a long-term uptrend trend on the weekly chart, as it trades within an established bullish channel. Yet this channel allows for some large swings, and a lower high in September is just one clue that the downside beckons.
The lower indicator measures the % distance from its 52-week high or low. Historically, rallies around 25-30% from the 52-week low have triggered a sizable correction, a threshold which was achieved at this year’s high. Furthermore, five bullish weeks were seen ahead of a spinning top doji and, itself a candidate for a swing high. As price action has now breached the doji low, it further suggests a top is in on the weekly chart.
Switching to the daily chart has seen a bearish break of a bullish channel. And not only was this bearish outside day its worst session in 7-weeks, but it opened at the high and closed at the low to produce a bearish Marabuzo candle. One method to use such elongated candles is to simply measure the 50% of its range to use as an invalidation point if it is crossed. And yesterday’s candle has also formed a lower high ahead of the breakout.
- Whilst prices closed beneath 6,660 support, the 50-day average is providing support for now.
- Given the bearish clues overall, we remain bearish on the daily chart below 6743.7. However, the 50% Marabuzo line can be used to invalidate the bias, if a more aggressive approach is preferred.
- A break beneath the 50-day eMA could suggest the downside is to continue, and bears could target the base of the channel just above the 6,400 and use 6,500 as an interim target.
- Due to the mean reversion potential of the weekly chart, we’ll continue to monitor its potential for a much larger breakdown as price action unfolds.
Related tags:




The complete CFD trading experience
Award-winning platforms, competitive spreads, low commissions and dedicated support.
We live and breathe the markets and are dedicated to helping traders realise their ambitions as we continue to set the industry bar.
Economic calendar
Web Trader platform
Our sophisticated web-based platform is packed with features.
Related articles
AUD/USD Shorts Bear the Brunt of Hot CPI, Renewed RBA Hike Bets
Hot Australian CPI revives RBA hike bets, lifts bond yields and adds fresh pressure to crowded AUD/USD short positions.


Australian Dollar Outlook: Sentiment Rebounds, AUD/USD Nears Resistance
Australian consumer sentiment rebounds sharply, but softer RBA hike expectations and resistance near 0.7140 could test AUD/USD bulls.

Cyclical stocks sniff out better times ahead
Different economies, different drivers, similar price action. The German DAX, ASX 200 and Russell 2000 are all hinting at a more optimistic view on the global economy.

StoneX Europe Ltd may make third party material available on this website which may contain information included but not limited to the conditions of financial markets. The material is for information purposes only and does not contain, and should not be construed as containing, investment advice and/or investment recommendation and/or an investment research and/or an offer of or solicitation for any transactions in financial instruments; any decision to enter into a specific transaction shall be made by the client following an assessment by him/her of their situation.
StoneX Europe Ltd makes no representation or warranty and assumes no liability as to the accuracy or completeness of the information provided, nor any loss arising from any investment based on a recommendation, forecast or other information supplied. You should always seek independent advice as to your suitability to speculate in any related markets and your ability to assume the associated risks, if you are at all unsure. We are not under any obligation to update any such material. Any opinion made may be personal to the author and may not reflect the opinion of StoneX Europe Ltd.