




AUD/USD, EUR/JPY analysis: European open – 07/09/2023
Asian equity markets were lower following China's trade data, yet US yields and the dollar pulled back to help AUD/USD hold above its cycle lows. I continue to suspect EUR/JPY has topped out on the daily chart, and today highlight a potential short setup beneath a resistance zone.
Share this:

Asian Indices:
- Australia's ASX 200 index fell by -91.4 points (-1.26%) and currently trades at 7,165.70
- Japan's Nikkei 225 index has fallen by -218.37 points (-0.66%) and currently trades at 33,022.65
- Hong Kong's Hang Seng index has fallen by -175.07 points (-0.95%) and currently trades at 18,274.91
- China's A50 Index has fallen by -106.99 points (-0.84%) and currently trades at 12,704.70
UK and Europe:
- UK's FTSE 100 futures are currently down -19 points (-0.26%), the cash market is currently estimated to open at 7,407.14
- Euro STOXX 50 futures are currently down -14 points (-0.33%), the cash market is currently estimated to open at 4,224.26
- Germany's DAX futures are currently down -51 points (-0.32%), the cash market is currently estimated to open at 15,690.37
US Futures:
- DJI futures are currently down -52 points (-0.15%)
- S&P 500 futures are currently down -8 points (-0.18%)
- Nasdaq 100 futures are currently down -41.5 points (-0.27%)
It was a very quiet Asian session, with currency markets mostly retracing against Wednesday’s moves within various degrees. Yet Asian equity markets were mostly lower following trade data from China.
China’s trade data was not as bad as expected, with exports declining -8.8% y/y (-9.1% expected, -14.5% prior) and imports falling -7.3% (-9% expected, -12.4%), although the market reaction was muted.
I think we’re all fatigued over weak the China-data theme. Trade data was expected to come in relatively soft, and whilst it surpassed expectations we’re going to need to see a much stronger beat to get markets out of their rocking chairs. And think we’re all just glad the negative numbers weren’t in double digits again.
BOJ member Nakagawa aid the central bank should be vigilant to the risk of a global slowdown, although added there is a risk that inflation could rise faster than expected with Japanese companies raising prices and wages.
- US bond yields pulled back slightly from Wednesday’s highs and the US dollar index treaded water in a tight range, in the upper wick of Wednesday’s indecision candle
- USD/JPY briefly tapped a 10-month high after the Tokyo open, yet its pullback within the first hour of trade currently mark the daily high (just as it did on Wednesday)
- USD/CAD formed a bearish pinbar around the April and May highs with the BOC’s hawkish hold helping to keep the lid on a runaway breakout. But if yields pull pack further today then perhaps we’ll see USD/CAD retrace
- WTI crude oil printed a tweezer top on the daily chart to suggest near-term exhaustion around $88, which leaves the potential for it to snap its six-day winning streak
- Gold closed beneath the 200-day MA but has the 200-day EMA nearby for potential support around 1910, although it may require the US dollar and yields to pull back from their highs
Events in focus (GMT+1):
- 07:00 – German industrial production
- 09:30 – ECB's Elderson Speaks
- 10:00 – European GDP, employment
- 13:30 – US jobless claims
AUD/USD technical analysis (daily chart):
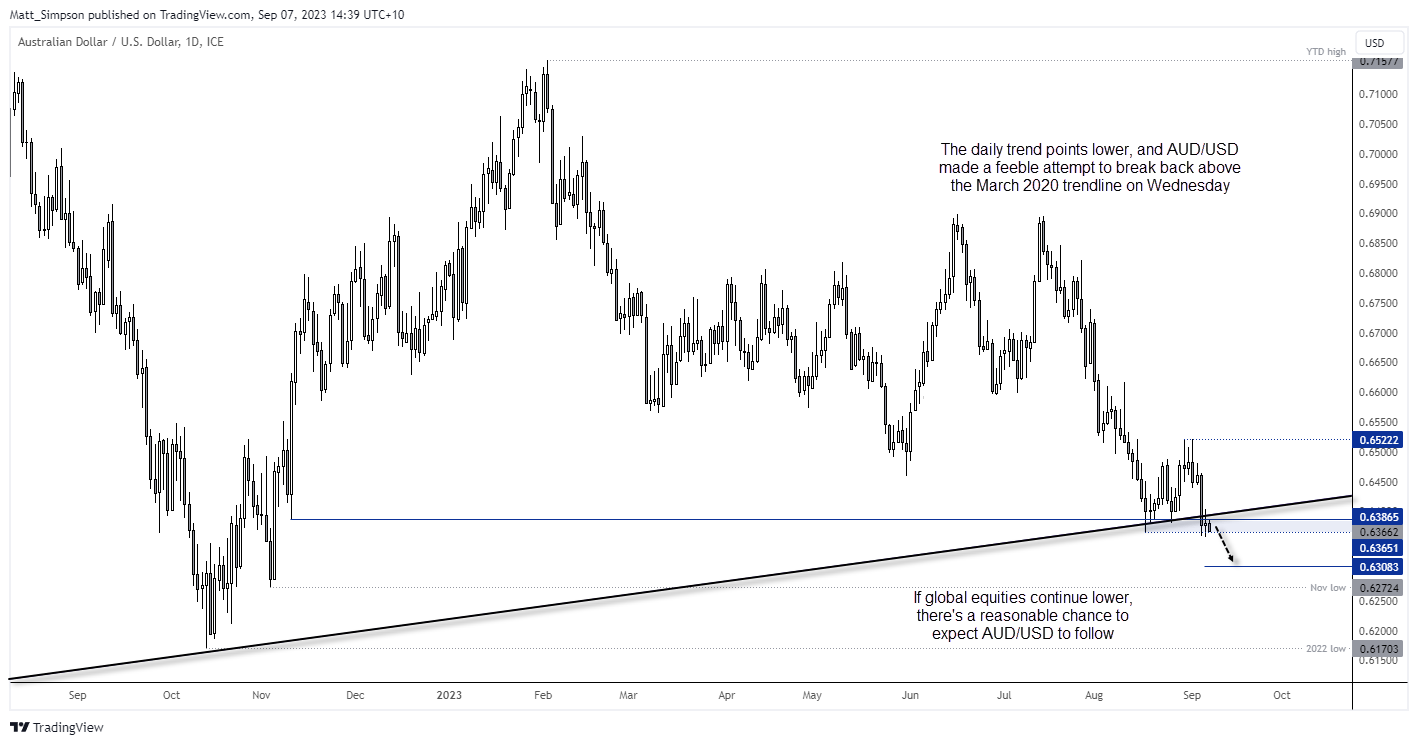
There’s not a lot to update on my AUD/USD analysis, given it has failed to bounce from the cycle lows and is now considering a break beneath them. Note that yesterday’s high (and indecision candle) made a feeble attempt to break back above the March 2020 trendline, and if global stocks trade lower today then there is a reasonable chance to expect AUD/USD to follow them, and head towards 63c.
EUR/JPY technical analysis (daily chart):
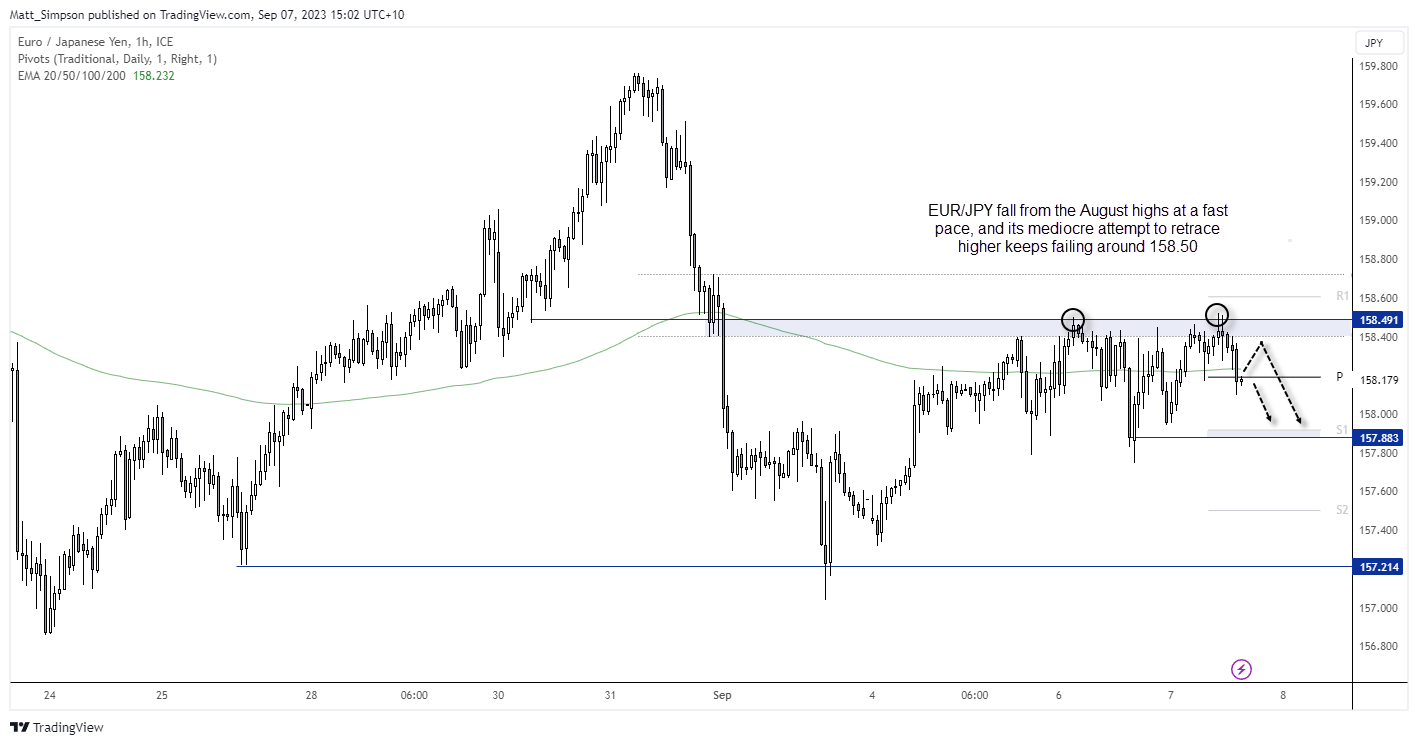
Hand up, this is not the prettiest price action I have seen in a while. However, it is clearly struggling to break above the 158.50 area having formed a double top in the area. Its mediocre rise from the September low pales in comparison to the drop form the August highs, which leads me to believe current price action is corrective and it is preparing for another leg lower.
This also fits in line with earlier analysis where I suggested EUR/JPY may have topped on the daily chart. For today, we may see some noise around the open and for prices to try and regain ground above the daily pivot point / 200-bar EMA, but bears could seek evidence of weakness below the upper resistance zone for an anticipated move towards 158 and 157.85.
View the full economic calendar
View the full economic calendar
-- Written by Matt Simpson
Follow Matt on Twitter @cLeverEdge
How to trade with City Index
You can trade with City Index by following these four easy steps:
- Open an account, or log in if you’re already a customer
• Open an account in the UK
• Open an account in Australia
• Open an account in Singapore
- Search for the market you want to trade in our award-winning platform
- Choose your position and size, and your stop and limit levels
- Place the trade
Related tags:
Latest market news



The complete CFD trading experience
Award-winning platforms, competitive spreads, low commissions and dedicated support.
We live and breathe the markets and are dedicated to helping traders realise their ambitions as we continue to set the industry bar.
Economic calendar
Web Trader platform
Our sophisticated web-based platform is packed with features.
Related articles
EUR/USD weekly outlook: Oil, inflation and NFP in focus
After coming under significant pressure in recent weeks, the EUR/USD came off its lows to finish the week on a positive note on Friday, albeit with only a mild rebound. That was not enough to prevent the exchange rate falling for the third consecutive week, as the US dollar and bond yields rallied across the board.
Gold Q4 2026 outlook: Resilience in the face of rallying dollar and yields
As we headed towards the latter stages of Q3 and into Q4, the Fed had just hiked rates in a hawkish FOMC meeting, while the likes of the ECB and BoJ had also tightened their respective policies. Oil prices remained elevated amid the prolonged US-Iran conflict. Meanwhile, bond yields were breaking out, and the dollar was higher across the board. Yet, remarkably, gold was still holding in the positive territory for the third quarter, even if it had weakened somewhat in September.

Oil Quietly Hands the Fed a Reason to Stay Hawkish
Oil prices and the U.S. dollar are both on the front foot as elevated energy costs feed Fed warnings that inflation may prove sticky.
StoneX Europe Ltd may make third party material available on this website which may contain information included but not limited to the conditions of financial markets. The material is for information purposes only and does not contain, and should not be construed as containing, investment advice and/or investment recommendation and/or an investment research and/or an offer of or solicitation for any transactions in financial instruments; any decision to enter into a specific transaction shall be made by the client following an assessment by him/her of their situation.
StoneX Europe Ltd makes no representation or warranty and assumes no liability as to the accuracy or completeness of the information provided, nor any loss arising from any investment based on a recommendation, forecast or other information supplied. You should always seek independent advice as to your suitability to speculate in any related markets and your ability to assume the associated risks, if you are at all unsure. We are not under any obligation to update any such material. Any opinion made may be personal to the author and may not reflect the opinion of StoneX Europe Ltd.