



Can bears still drive Tesla (TSLA) down to $100?
On the 20th of October we outlined a bearish scenario on Tesla which outlined a bearish target around $100. Today we check in on how that is playing out.
Share this:

A lot has happened in the two months since we outlined a bearish scenario, and they have mostly worked against Tesla and played nicely with our bearish bias.
The company has had to reduce production and slow its hiring as demand in China has fallen below expectations, with COVID and its associated lockdowns not helping either. Yet demand is clearly not living up to expectations in the US either, with a US $3750 incentive offered to customers who take delivery of certain vehicles now, instead of waiting a year for other models.

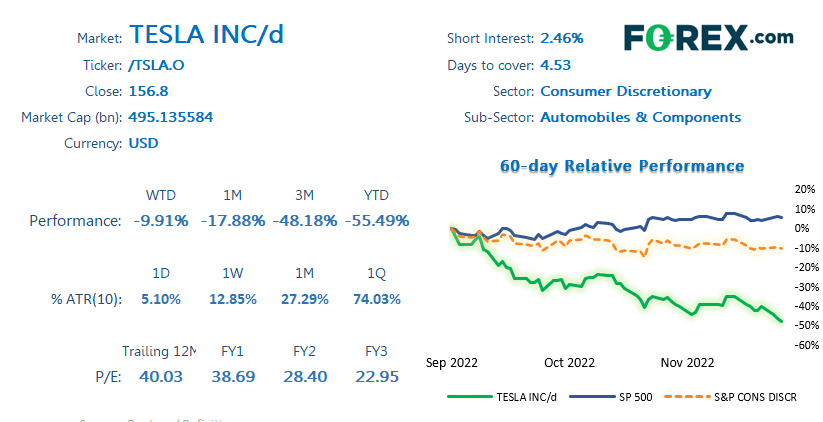
And there’s also the issue with Twitter, where the CEO is seemingly spending much of his time trolling the Twittersphere with his new toy after firing large proportions of its workforce. The prospects of higher interest rates haven’t helped much either, although it is worth noting the stock has fallen a further -5% since the last article compared to the Nasdaq’s 7.5% rise. Tesla is currently trading at 29x its projected earnings which, whilst above the S&P 500’s x17, is the lowest since it went public in 2020. And for the first time in 13-months its market value is now below $500 billion. Let’s see how this has all impacted price action.
Tesla (TSLA) monthly chart:


Tesla has fallen over 25% since our last article, in which we pointed out the potential head and shoulders reversal pattern, which projects an approximate target around $100 on a logarithmic chart (we use these on long-term charts, especially on markets which have rallied 1000’s of percent). Now sitting at a 25-month low it is approaching the halfway point to the downside target, but we need to keep in mind that monthly charts allow for plenty of volatility within each monthly candle. Also, the stock is within its fifth consecutive month low which is currently a record – which itself leaves us on guard fort some mean reversion along the way.
Tesla (TSLA) daily chart:


Whilst the monthly chart is likely to retrace at some point, there are no immediate signs of a trough on the daily charet right now – other than a small bearish candle which suggests bearish momentum is waning at the lows.
- Prices are beneath the monthly R2 pivot and 166.19 low and the near-term bias remains bearish whilst prices remain beneath that zone.
- 140 is a viable interim target, ahead of the October 2020 low near the monthly S pivot point.
- If prices retrace higher then bears could consider fading into low volatility moves below 18 to target 140 and 126.37.
- A break above 200 assumes a deeper retracement is underway, although the bias remains for a move down to $100 on the monthly chart.
How to trade with FOREX.com
Follow these easy steps to start trading with FOREX.com today:
- Open a Forex.com account, or log in if you’re already a customer.
- Search for the pair you want to trade in our award-winning platform.
- Choose your position and size, and your stop and limit levels.
- Place the trade.
How to trade with City Index
You can trade with City Index by following these four easy steps:
- Open an account, or log in if you’re already a customer
• Open an account in the UK
• Open an account in Australia
• Open an account in Singapore
- Search for the market you want to trade in our award-winning platform
- Choose your position and size, and your stop and limit levels
- Place the trade
Related tags:
Latest market news




The complete CFD trading experience
Award-winning platforms, competitive spreads, low commissions and dedicated support.
We live and breathe the markets and are dedicated to helping traders realise their ambitions as we continue to set the industry bar.
Economic calendar
Web Trader platform
Our sophisticated web-based platform is packed with features.
Related articles
EUR/USD weekly outlook: Oil, inflation and NFP in focus
After coming under significant pressure in recent weeks, the EUR/USD came off its lows to finish the week on a positive note on Friday, albeit with only a mild rebound. That was not enough to prevent the exchange rate falling for the third consecutive week, as the US dollar and bond yields rallied across the board.

Gold Q4 2026 outlook: Resilience in the face of rallying dollar and yields
As we headed towards the latter stages of Q3 and into Q4, the Fed had just hiked rates in a hawkish FOMC meeting, while the likes of the ECB and BoJ had also tightened their respective policies. Oil prices remained elevated amid the prolonged US-Iran conflict. Meanwhile, bond yields were breaking out, and the dollar was higher across the board. Yet, remarkably, gold was still holding in the positive territory for the third quarter, even if it had weakened somewhat in September.

Oil Quietly Hands the Fed a Reason to Stay Hawkish
Oil prices and the U.S. dollar are both on the front foot as elevated energy costs feed Fed warnings that inflation may prove sticky.
StoneX Europe Ltd may make third party material available on this website which may contain information included but not limited to the conditions of financial markets. The material is for information purposes only and does not contain, and should not be construed as containing, investment advice and/or investment recommendation and/or an investment research and/or an offer of or solicitation for any transactions in financial instruments; any decision to enter into a specific transaction shall be made by the client following an assessment by him/her of their situation.
StoneX Europe Ltd makes no representation or warranty and assumes no liability as to the accuracy or completeness of the information provided, nor any loss arising from any investment based on a recommendation, forecast or other information supplied. You should always seek independent advice as to your suitability to speculate in any related markets and your ability to assume the associated risks, if you are at all unsure. We are not under any obligation to update any such material. Any opinion made may be personal to the author and may not reflect the opinion of StoneX Europe Ltd.