





China and US CPI and PPI Is it transitory
This week’s CPI and PPI out of the US will give traders a better idea of where inflation is headed
Share this:

China released both CPI and PPI data earlier and the results point to worries that inflation may pick up faster than expected. China’s YoY CPI print was 0.9% vs 0.4% in March. This is the highest reading since September 2020. This big gainer in the CPI data was transportation and communication, which was 4.9% vs 2.7% in March. Pork prices continued to decline, -21.4% vs -18.4% last. The MoM headline reading was -0.3% vs -0.5% in March.
But what was more interesting was PPI
PPI is a measure of producer prices. It tells what businesses are paying for materials they use to make their products. In theory, these prices will be passed on to the consumer at some point in the future. China’s YoY PPI for April was 6.8% vs 6.5% in March and only 4.4% expected! This is the highest reading since October 2017! Think about how much commodities, such as lumber and iron ore, have gone up over the last month. The big question is “When will these price increases show up in the CPI data?”.
Now it’s time for the US release
On Wednesday, the US will release April data for CPI and on Thursday, for PPI. Expectations for CPI are 3.6% YoY for the headline print and 2.3% YoY for the Core Inflation Rate. PPI is expected to be 5.9% YoY for April.
Should the Fed be worried?
The Fed has indicated that after years of inflation below their target of 2%, they are willing to let inflation “run hot” for a period of time. However, if the headline result is as expected, inflation will be significantly above the Fed’s 2% target. One has to consider that if the PPI data is as expected, it will feed through to the consumer and the CPI. Does it matter? Probably not. The Fed has already indicated that they believe the current inflation is “transitory”. They need a “string of months” of actual data before they determine that inflation is too hot (whatever “too hot” is considered). If the US data is “as expected”, PPI in two of the largest economies in the world will be 6.8% and 5.9%, which is primary due commodities and raw materials. Even if the inflation is transitory, how long can central banks allow inflation to “run hot” until they begin tightening rates?
Everything you need to know about the Federal Reserve
USD/CNH
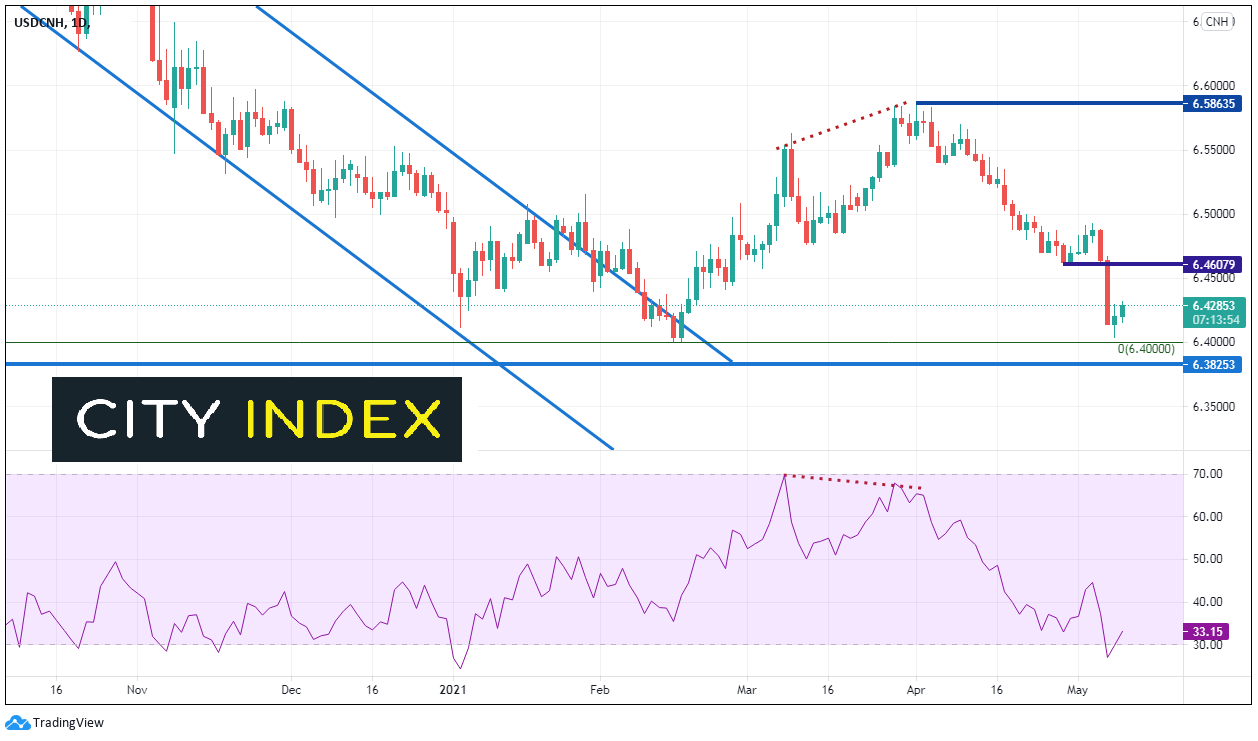
On a daily timeframe, USD/CNH had been moving in a downward sloping channel since May 2020 before a 1 ½ month correction in February and March of this year. The pair began moving lower through April and tested the February lows yesterday near 6.4000.
Source Tradingview, City Index
On a 240-minute timeframe, USD/CNH formed a hammer candlestick the at bottom with the RSI below 20, indicating a possible reversal. Prices did bounce, however so far, USD/CNH can’t even reach the 38.2% Fibonacci retracement from the May 5th highs to the yesterday’s lows near 6.4378. Resistance above is at the 38.2%. 50%, and 61.8% Fibonacci retracement levels from the same timeframe at 6.4379, 6.4483, and 6.4587, respectively. There is also horizontal resistance slightly above the 61.8% Fib retracement at 6.4603. Support is a yesterday’s lows near 6.4039, just ahead of the February 15th lows at 6.4007.
Source Tradingview, City Index
In addition, on a weekly timeframe (not shown), there is horizonal support below at 6.3825, dating back to May 2018.
This week’s CPI and PPI out of the US will give traders a better idea of where inflation is headed. Will the data be transitory or not? Is it hot, or too hot? These are the questions traders will be asking themselves over the next few months!
Learn more about forex trading opportunities.
China released both CPI and PPI data earlier and the results point to worries that inflation may pick up faster than expected. China’s YoY CPI print was 0.9% vs 0.4% in March. This is the highest reading since September 2020. This big gainer in the CPI data was transportation and communication, which was 4.9% vs 2.7% in March. Pork prices continued to decline, -21.4% vs -18.4% last. The MoM headline reading was -0.3% vs -0.5% in March.
But what was more interesting was PPI
PPI is a measure of producer prices. It tells what businesses are paying for materials they use to make their products. In theory, these prices will be passed on to the consumer at some point in the future. China’s YoY PPI for April was 6.8% vs 6.5% in March and only 4.4% expected! This is the highest reading since October 2017! Think about how much commodities, such as lumber and iron ore, have gone up over the last month. The big question is “When will these price increases show up in the CPI data?”.
Now it’s time for the US release
On Wednesday, the US will release April data for CPI and on Thursday, for PPI. Expectations for CPI are 3.6% YoY for the headline print and 2.3% YoY for the Core Inflation Rate. PPI is expected to be 5.9% YoY for April.
Should the Fed be worried?
The Fed has indicated that after years of inflation below their target of 2%, they are willing to let inflation “run hot” for a period of time. However, if the headline result is as expected, inflation will be significantly above the Fed’s 2% target. One has to consider that if the PPI data is as expected, it will feed through to the consumer and the CPI. Does it matter? Probably not. The Fed has already indicated that they believe the current inflation is “transitory”. They need a “string of months” of actual data before they determine that inflation is too hot (whatever “too hot” is considered). If the US data is “as expected”, PPI in two of the largest economies in the world will be 6.8% and 5.9%, which is primary due commodities and raw materials. Even if the inflation is transitory, how long can central banks allow inflation to “run hot” until they begin tightening rates?
Everything you need to know about the Federal Reserve
USD/CNH
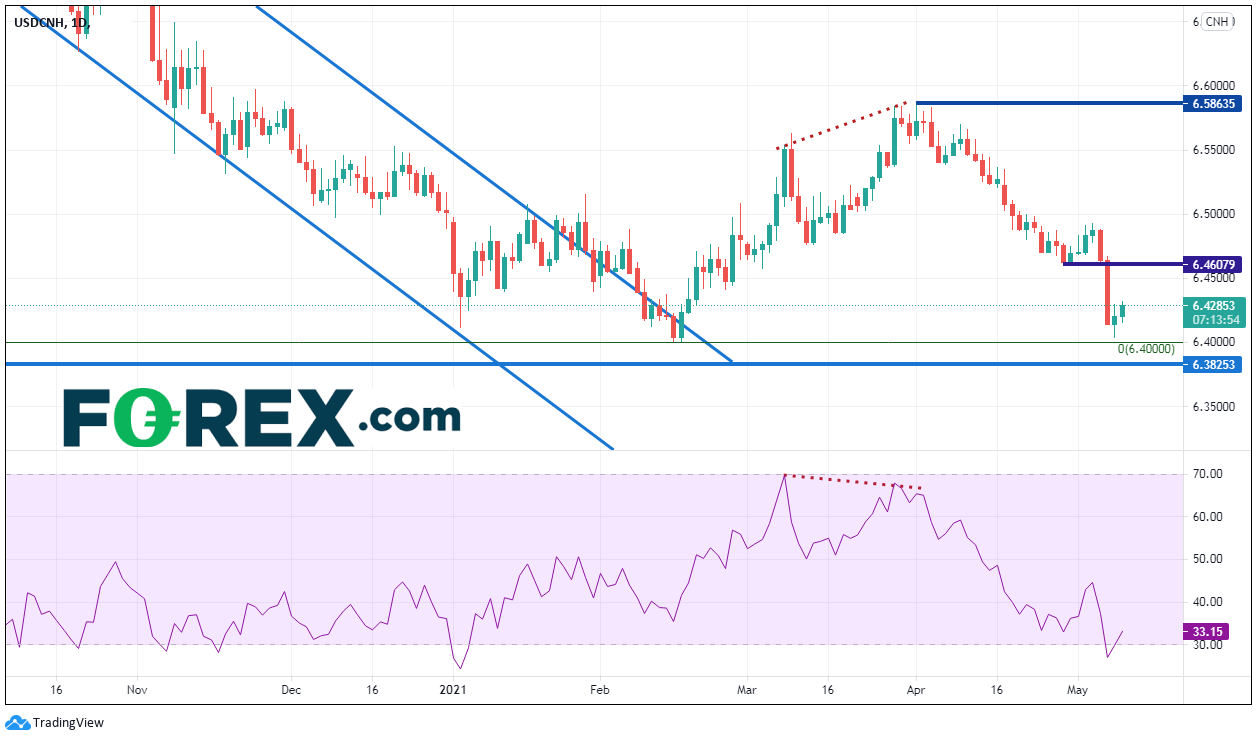
On a daily timeframe, USD/CNH had been moving in a downward sloping channel since May 2020 before a 1 ½ month correction in February and March of this year. The pair began moving lower through April and tested the February lows yesterday near 6.4000.
Source Tradingview, FOREX.com
On a 240-minute timeframe, USD/CNH formed a hammer candlestick the at bottom with the RSI below 20, indicating a possible reversal. Prices did bounce, however so far, USD/CNH can’t even reach the 38.2% Fibonacci retracement from the May 5th highs to the yesterday’s lows near 6.4378. Resistance above is at the 38.2%. 50%, and 61.8% Fibonacci retracement levels from the same timeframe at 6.4379, 6.4483, and 6.4587, respectively. There is also horizontal resistance slightly above the 61.8% Fib retracement at 6.4603. Support is a yesterday’s lows near 6.4039, just ahead of the February 15th lows at 6.4007.
Source Tradingview, FOREX.com
In addition, on a weekly timeframe (not shown), there is horizonal support below at 6.3825, dating back to May 2018.
This week’s CPI and PPI out of the US will give traders a better idea of where inflation is headed. Will the data be transitory or not? Is it hot, or too hot? These are the questions traders will be asking themselves over the next few months!
Learn more about forex trading opportunities.
Related tags:
Latest market news




The complete CFD trading experience
Award-winning platforms, competitive spreads, low commissions and dedicated support.
We live and breathe the markets and are dedicated to helping traders realise their ambitions as we continue to set the industry bar.
Economic calendar
Web Trader platform
Our sophisticated web-based platform is packed with features.
Related articles
USD/JPY outlook: Hawkish Fed recalibration pressures the yen
Stronger US growth momentum and rising Treasury yields are keeping USD/JPY pointed higher, even as Japanese policymakers try to limit the pressure building across domestic markets.
Gold, silver slammed as hawkish Fed repricing reignites dollar upside
Gold and silver had held up surprisingly well against surging US yields. Wednesday’s DXY breakout may have changed that equation.
USD/MXN Forecast: Peso Loses Momentum Ahead of Banxico Decision
Over recent trading sessions, the Mexican peso has started to show signs of losing strength against the U.S. dollar. This can be seen in the performance of USD/MXN, which has gained more than 1.7% over the last three sessions, highlighting the dollar's renewed strength against the peso.

StoneX Europe Ltd may make third party material available on this website which may contain information included but not limited to the conditions of financial markets. The material is for information purposes only and does not contain, and should not be construed as containing, investment advice and/or investment recommendation and/or an investment research and/or an offer of or solicitation for any transactions in financial instruments; any decision to enter into a specific transaction shall be made by the client following an assessment by him/her of their situation.
StoneX Europe Ltd makes no representation or warranty and assumes no liability as to the accuracy or completeness of the information provided, nor any loss arising from any investment based on a recommendation, forecast or other information supplied. You should always seek independent advice as to your suitability to speculate in any related markets and your ability to assume the associated risks, if you are at all unsure. We are not under any obligation to update any such material. Any opinion made may be personal to the author and may not reflect the opinion of StoneX Europe Ltd.