



Comments from NATO meeting send Gold and USD/PLN higher
Investors who were unease about the ongoing Russia/Ukraine conflict now have even more to worry about.
Share this:

Investors who were unease about the ongoing Russia/Ukraine conflict now have even more to worry about. US President Joe Biden traveled to Europe this week to meet with NATO allies and discuss the situation. After the meeting, headlines released said that NATO is preparing for the risk of Russian nuclear incidents. In addition, Biden told NATO that he supports increased NATO troops on the Eastern front. Oh, and did I mention that the G-7 plans on warning Russia over its use of chemical and nuclear weapons? These comments will only increase the tensions between Russia and the West, causing further uncertainties. As a result, funds are flowing into the safe-haven asset of Gold.
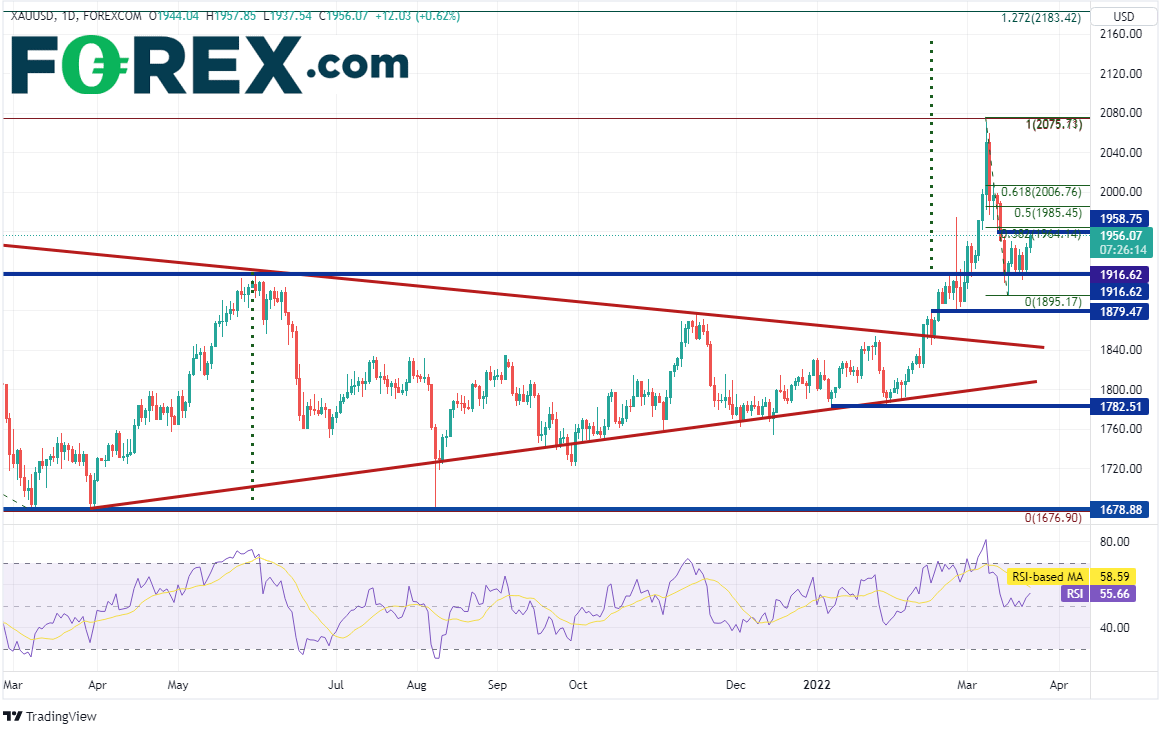
Gold had been in a symmetrical triangle since April 1st, 2021 before finally breaking above the top trendline of the pattern on February 11th near 1850. In addition, Gold had formed a double bottom in mid-2021 and broke above the neckline of the pattern on the day Russian invaded Ukraine, February 24th, near 1916. The target for the double bottom is near 2150.
Source: Tradingview, Stone X
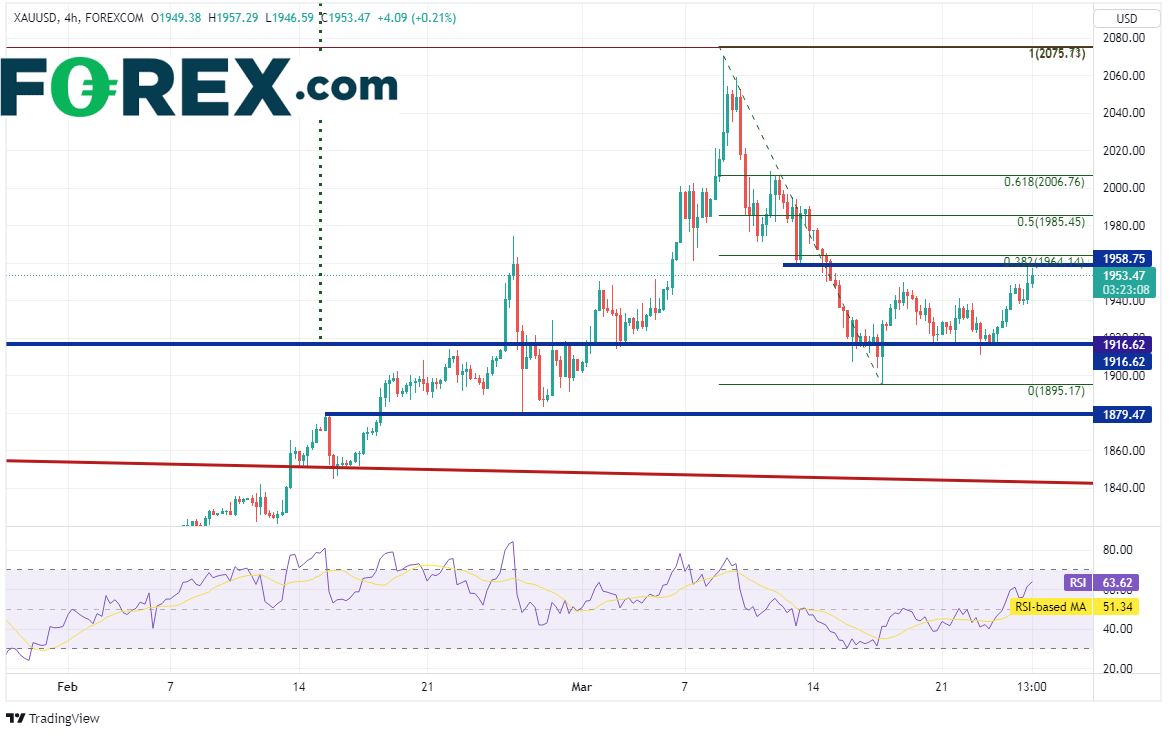
XAU/USD moved to a recent high of 2070.46 on March 8th, testing the all-time highs at 2075.11 from the summer of 2020. Since then, price pulled back and held support at the breakout of the double bottom pattern. On today’s headlines from NATO, price bounced into resistance near the low from March 11th at 1958.75. This is also near the double 38.2% Fibonacci retracement from the highs of March 8th to the lows of March 16th. Additional resistance is at the 50 % retracement and the 61.8% Fibonacci retracement from the same timeframe at 1985.45 and 2006.76, respectively. Support is at the March 16th lows near 1895.17, then horizontal support at 1879.47. If price breaks below there, the next level of support isn’t until the top, downward sloping trendline of the long-term triangle (see daily) near 1845.
Source: Tradingview, Stone X
USD/PLN has a strong positive correlation with Gold. The current correlation coefficient between Gold and USD/PLN is +0.81. Any reading above +0.80 is considered strong. Just as with Gold, USD/PLN began moving aggressively higher after Russia invaded Ukraine, above previous all-time highs at 4.3078 on March 2nd. The pair continued higher and made a new all-time high on March 7th at 4.6199. Since then, USD/PLN pulled back to horizontal support at 4.2042 and has been moving higher since.

Source: Tradingview, Stone X
On a 240-minute timeframe, the correlation coefficient is even higher than on the daily at +0.87, USD/PLN is currently sitting at trendline resistance near 4.3384. A move above targets Fibonacci retracement levels from the highs of March 7th to the recent lows on March 17th, starting with the 38.2% level at 4.3565. Above there is the 50% retracement level and horizontal resistance at 4.4068 and 4.4416, respectively. Support is at the recent lows of 4.204 and the 61.8% Fibonacci retracement from the February 10th lows to the March 7th highs at 4.1832 (see daily).

Source: Tradingview, Stone X
Investors who were unease about the ongoing Russia/Ukraine conflict now have even more to worry about. US President Joe Biden traveled to Europe this week to meet with NATO allies and discuss the situation. After the meeting, headlines released said that NATO is preparing for the risk of Russian nuclear incidents. In addition, Biden told NATO that he supports increased NATO troops on the Eastern front. Oh, and did I mention that the G-7 plans on warning Russia over its use of chemical and nuclear weapons? These comments will only increase the tensions between Russia and the West, causing further uncertainties. As a result, funds are flowing into the safe-haven asset of Gold.
Trade Gold (XAU/USD) now: Login or Open a new account!
• Open an account in the UK
• Open an account in Australia
• Open an account in Singapore
Gold had been in a symmetrical triangle since April 1st, 2021 before finally breaking above the top trendline of the pattern on February 11th near 1850. In addition, Gold had formed a double bottom in mid-2021 and broke above the neckline of the pattern on the day Russian invaded Ukraine, February 24th, near 1916. The target for the double bottom is near 2150.
Source: Tradingview, Stone X
XAU/USD moved to a recent high of 2070.46 on March 8th, testing the all-time highs at 2075.11 from the summer of 2020. Since then, price pulled back and held support at the breakout of the double bottom pattern. On today’s headlines from NATO, price bounced into resistance near the low from March 11th at 1958.75. This is also near the double 38.2% Fibonacci retracement from the highs of March 8th to the lows of March 16th. Additional resistance is at the 50 % retracement and the 61.8% Fibonacci retracement from the same timeframe at 1985.45 and 2006.76, respectively. Support is at the March 16th lows near 1895.17, then horizontal support at 1879.47. If price breaks below there, the next level of support isn’t until the top, downward sloping trendline of the long-term triangle (see daily) near 1845.

Source: Tradingview, Stone X
USD/PLN has a strong positive correlation with Gold. The current correlation coefficient between Gold and USD/PLN is +0.81. Any reading above +0.80 is considered strong. Just as with Gold, USD/PLN began moving aggressively higher after Russia invaded Ukraine, above previous all-time highs at 4.3078 on March 2nd. The pair continued higher and made a new all-time high on March 7th at 4.6199. Since then, USD/PLN pulled back to horizontal support at 4.2042 and has been moving higher since.

Source: Tradingview, Stone X
Trade USD/PLN now: Login or Open a new account!
• Open an account in the UK
• Open an account in Australia
• Open an account in Singapore
On a 240-minute timeframe, the correlation coefficient is even higher than on the daily at +0.87, USD/PLN is currently sitting at trendline resistance near 4.3384. A move above targets Fibonacci retracement levels from the highs of March 7th to the recent lows on March 17th, starting with the 38.2% level at 4.3565. Above there is the 50% retracement level and horizontal resistance at 4.4068 and 4.4416, respectively. Support is at the recent lows of 4.204 and the 61.8% Fibonacci retracement from the February 10th lows to the March 7th highs at 4.1832 (see daily).

Source: Tradingview, Stone X
Learn more about forex trading opportunities.
Related tags:
Latest market news




The complete CFD trading experience
Award-winning platforms, competitive spreads, low commissions and dedicated support.
We live and breathe the markets and are dedicated to helping traders realise their ambitions as we continue to set the industry bar.
Economic calendar
Web Trader platform
Our sophisticated web-based platform is packed with features.
Related articles
USD/JPY Weekly Outlook: Volatility Has Left the Building
The yen has ignored broad dollar weakness, falling Treasury yields and renewed market turbulence. Yet its relationship with US interest rates remains intact. So why is USD/JPY going absolutely nowhere fast?
Gold Analysis: XAU/USD Ends the Week Without a Clear Trend
The trading week is coming to an end, and a sense of neutrality remains evident around gold's short-term price action. Over the last five trading sessions, the metal has posted a move of barely -0.3%, a situation that continues to highlight a growing phase of indecision and reflects a clear lack of direction across the market.

Swiss Franc Forecast: USD/CHF Seven-Week Rally Reverses From Yearly Highs 10 16 2026
A sharp rejection from fresh highs has shifted momentum in favor of USD/CHF bears, raising the stakes for a critical support test.

StoneX Europe Ltd may make third party material available on this website which may contain information included but not limited to the conditions of financial markets. The material is for information purposes only and does not contain, and should not be construed as containing, investment advice and/or investment recommendation and/or an investment research and/or an offer of or solicitation for any transactions in financial instruments; any decision to enter into a specific transaction shall be made by the client following an assessment by him/her of their situation.
StoneX Europe Ltd makes no representation or warranty and assumes no liability as to the accuracy or completeness of the information provided, nor any loss arising from any investment based on a recommendation, forecast or other information supplied. You should always seek independent advice as to your suitability to speculate in any related markets and your ability to assume the associated risks, if you are at all unsure. We are not under any obligation to update any such material. Any opinion made may be personal to the author and may not reflect the opinion of StoneX Europe Ltd.