


Core PCE higher than expected; Fed also paying close attention to ECI
There' s a new sheriff in town that the Fed is focusing on: ECI (Employment Cost Index).
Share this:

Considered to be the Fed’s favorite measure of inflation, December’s Core PCE (Personal Consumption Expenditure), which excludes food and energy, rose at a rate of 4.9% YoY. The print beat estimates of 4.8% YoY. It also was higher than November’s print of 4.7% YoY. This was the highest Core PCE reading since September 1983!
But there is a new sheriff in town that the Fed is focusing on: ECI (Employment Cost Index). Fed Chairman Powell referred this metric in his press conference following the FOMC meeting on Wednesday. The ECI shows employee compensation and total costs of labor for employers. The Fed has been paying attention to this economic data print, as Powell noted that rising wages were a contributing factor to the increase in overall inflation. The Q4 Employment Cost Index was 1% vs 1.2% expected and 1.3% in Q3. This print may calm the nerves of Fed officials, as the Q3 ECI was the highest in over 30 years.
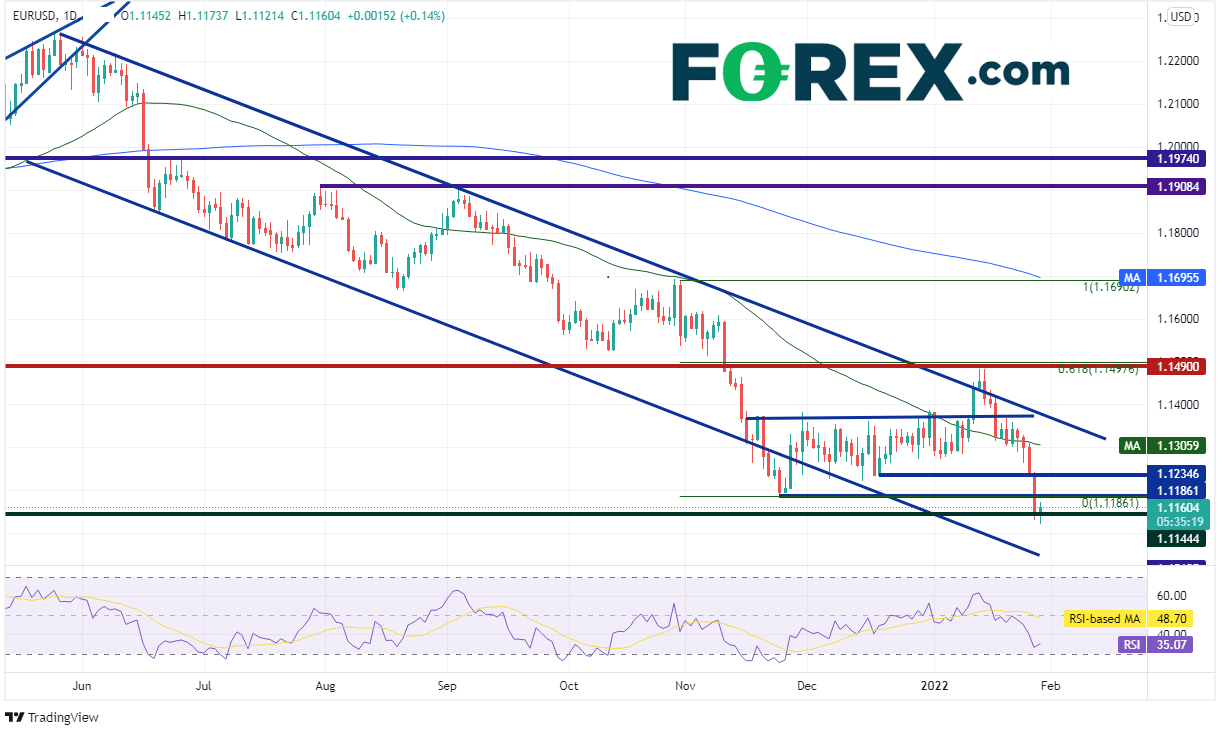
EUR/USD had been has been moving lower in an orderly channel since May 2021. After posting a false breakdown below the range to 1.1186 on November 24th, 2021, the pair moved back inside the channel. EUR/USD traded sideways in a tight range until January 12th, when the pair posted a false breakout to the topside of the channel near 1.1490. EUR/USD then pulled back inside the channel and has accelerated lower, taking out the out the 1.1186 low from November. Price has recently tested support from March 2020 near 1.1144.
Source: Tradingview, Stone X
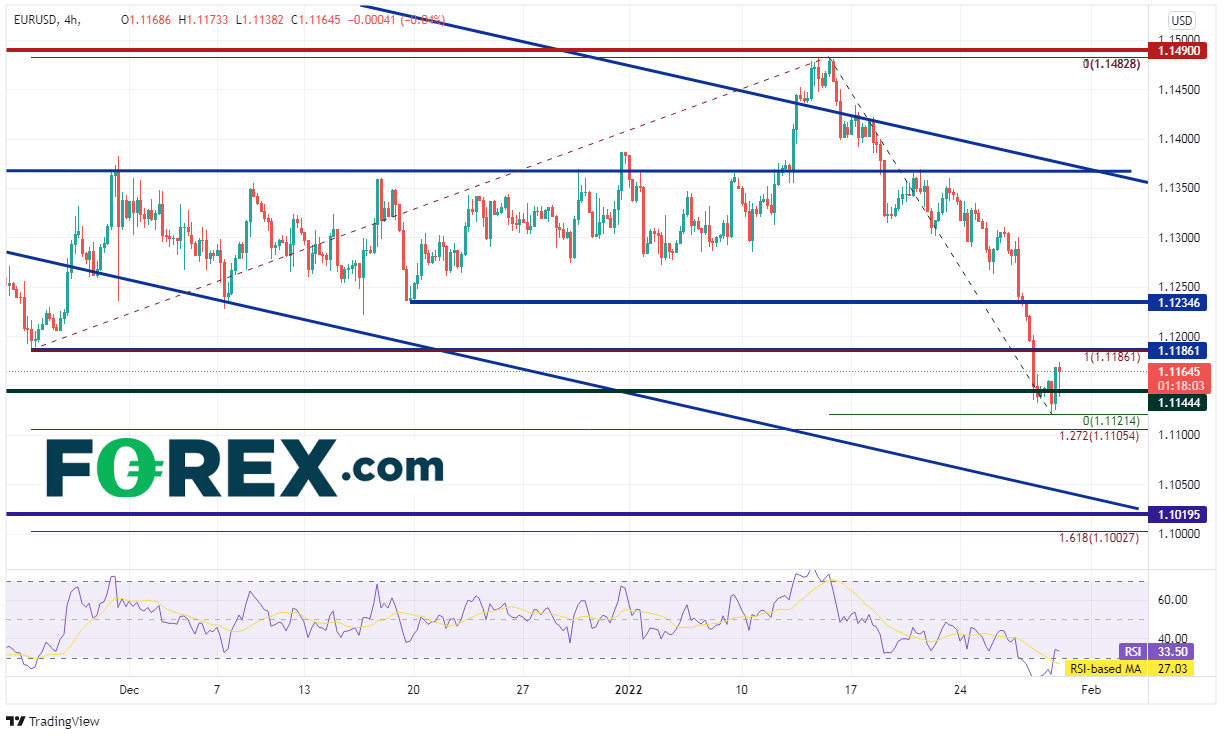
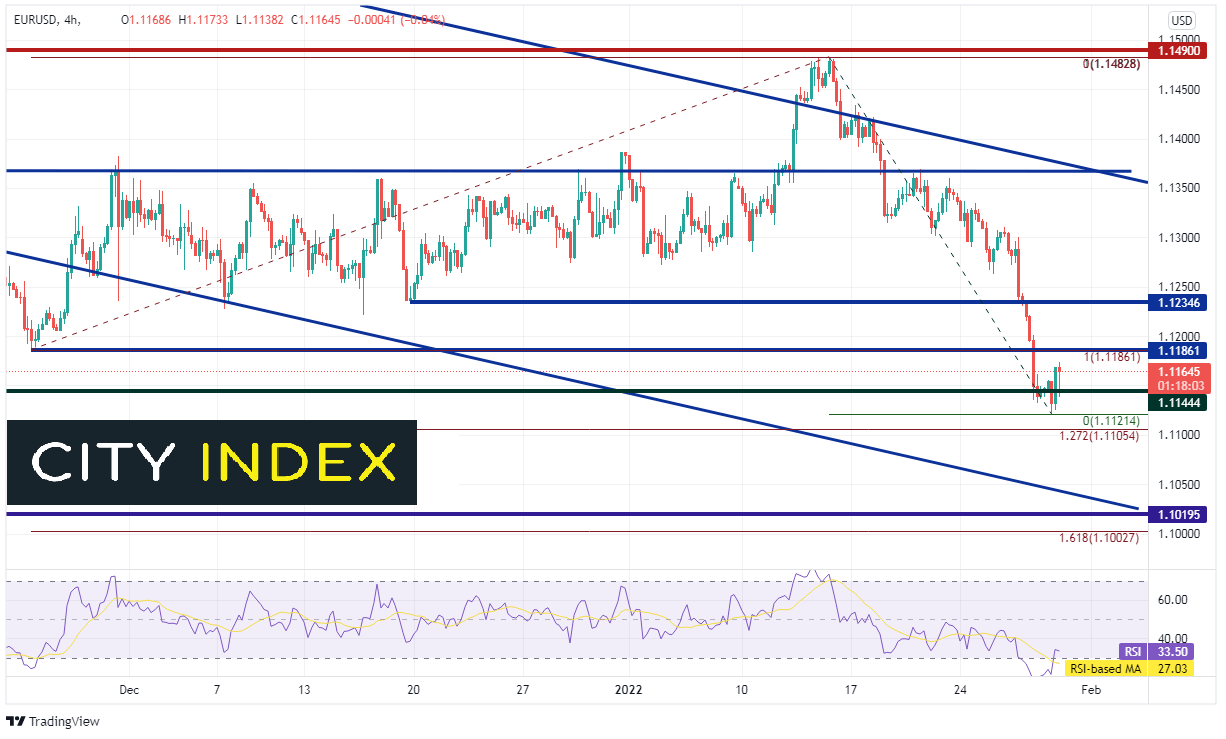
First resistance is at the prior breakdown point of 1.1186 and then horizontal resistance at 1.1234. Above there, resistance is at the 38.2% Fibonacci retracement from the highs of January 14th to the lows of January 28th, near 1.1260. Support below is plentiful. The first level is the January 28th lows at 1.1121, which confluences with the 127.2% Fibonacci extension from the November 24th lows to the January 14th highs at 1.1105. Below there, price can fall to the bottom trendline of the channel near 1.1041, which is just ahead of long-term horizontal support at 1.1020.
Source: Tradingview, Stone X
The Fed is very worried about inflation. Its favorite data point has been Core PCE, which was higher than expected. However, they have recently turned their attention to the ECI, which was better than expected. A rate hike is priced into the market for the March meeting. If the Core PCE begins to downtick, could they pull in the reigns just a bit after that? The Fed said they will be watching the data, therefore, we should as well!
Considered to be the Fed’s favorite measure of inflation, December’s Core PCE (Personal Consumption Expenditure), which excludes food and energy, rose at a rate of 4.9% YoY. The print beat estimates of 4.8% YoY. It also was higher than November’s print of 4.7% YoY. This was the highest Core PCE reading since September 1983!
But there is a new sheriff in town that the Fed is focusing on: ECI (Employment Cost Index). Fed Chairman Powell referred this metric in his press conference following the FOMC meeting on Wednesday. The ECI shows employee compensation and total costs of labor for employers. The Fed has been paying attention to this economic data print, as Powell noted that rising wages were a contributing factor to the increase in overall inflation. The Q4 Employment Cost Index was 1% vs 1.2% expected and 1.3% in Q3. This print may calm the nerves of Fed officials, as the Q3 ECI was the highest in over 30 years.
Trade EUR/USD now: Login or Open a new account!
• Open an account in the UK
• Open an account in Australia
• Open an account in Singapore
EUR/USD had been has been moving lower in an orderly channel since May 2021. After posting a false breakdown below the range to 1.1186 on November 24th, 2021, the pair moved back inside the channel. EUR/USD traded sideways in a tight range until January 12th, when the pair posted a false breakout to the topside of the channel near 1.1490. EUR/USD then pulled back inside the channel and has accelerated lower, taking out the out the 1.1186 low from November. Price has recently tested support from March 2020 near 1.1144.

Source: Tradingview, Stone X
First resistance is at the prior breakdown point of 1.1186 and then horizontal resistance at 1.1234. Above there, resistance is at the 38.2% Fibonacci retracement from the highs of January 14th to the lows of January 28th, near 1.1260. Support below is plentiful. The first level is the January 28th lows at 1.1121, which confluences with the 127.2% Fibonacci extension from the November 24th lows to the January 14th highs at 1.1105. Below there, price can fall to the bottom trendline of the channel near 1.1041, which is just ahead of long-term horizontal support at 1.1020.
Source: Tradingview, Stone X
The Fed is very worried about inflation. Its favorite data point has been Core PCE, which was higher than expected. However, they have recently turned their attention to the ECI, which was better than expected. A rate hike is priced into the market for the March meeting. If the Core PCE begins to downtick, could they pull in the reigns just a bit after that? The Fed said they will be watching the data, therefore, we should as well!
Learn more about forex trading opportunities.
Related tags:
Latest market news




The complete CFD trading experience
Award-winning platforms, competitive spreads, low commissions and dedicated support.
We live and breathe the markets and are dedicated to helping traders realise their ambitions as we continue to set the industry bar.
Economic calendar
Web Trader platform
Our sophisticated web-based platform is packed with features.
Related articles
USD/JPY Q4 2026 Outlook: Hawkish Fed Pricing Clashes With Intervention Risk
The year-end tug-of-war is clear: hawkish Fed pricing supports USD/JPY, while intervention risk limits the upside.


Japanese Yen Forecast: USD/JPY 4% Rally Challenges Post-Intervention Downtrend 9 24 2026
USD/JPY momentum has shifted sharply higher, putting a major resistance confluence in focus as U.S. and Japanese event risk builds.


Oil Quietly Hands the Fed a Reason to Stay Hawkish
Oil prices and the U.S. dollar are both on the front foot as elevated energy costs feed Fed warnings that inflation may prove sticky.

StoneX Europe Ltd may make third party material available on this website which may contain information included but not limited to the conditions of financial markets. The material is for information purposes only and does not contain, and should not be construed as containing, investment advice and/or investment recommendation and/or an investment research and/or an offer of or solicitation for any transactions in financial instruments; any decision to enter into a specific transaction shall be made by the client following an assessment by him/her of their situation.
StoneX Europe Ltd makes no representation or warranty and assumes no liability as to the accuracy or completeness of the information provided, nor any loss arising from any investment based on a recommendation, forecast or other information supplied. You should always seek independent advice as to your suitability to speculate in any related markets and your ability to assume the associated risks, if you are at all unsure. We are not under any obligation to update any such material. Any opinion made may be personal to the author and may not reflect the opinion of StoneX Europe Ltd.