



Crude oil forecast: WTI extends rally amid US-Iran tensions
Crude oil prices rose more than 3% by mid-day in London, causing stocks and bonds to drop. Prices have rallied after Trump said Iran had been given an opportunity to reach a deal but had failed to take it. But now Trump said an unprecedented economic operation against Iran will be underway, warning of severe economic consequences for countries providing support to Tehran.
Share this:

Crude oil prices rose more than 3% by mid-day in London, causing stocks and bonds to drop. Prices have rallied after Trump said Iran had been given an opportunity to reach a deal but had failed to take it. But now Trump said an unprecedented economic operation against Iran will be underway, warning of severe economic consequences for countries providing support to Tehran. Against this backdrop, the crude oil forecast remains bullish as before. That said, we could see a bit of profit-taking before the next leg up.
Diplomatic agreement chances dim further
The latest escalation pushes the prospect of a renewed ceasefire or diplomatic agreement further out of reach, while raising the risk of continued disruption to energy supplies.
There are some signs that underlying demand is moderating, with softer economic data from both the US and China recently pointing to slower growth. But the oil market remains predominantly supply-driven in the current environment.
Oil demand is relatively inelastic in the short term, meaning consumption does not fall particularly sharply as prices rise. A meaningful demand response generally requires prices to move substantially higher and remain elevated for some time. At current levels, I am not convinced we have reached that point yet.
That leaves the Strait of Hormuz as the critical variable. Unless the waterway reopens and supply risks begin to ease, it is difficult to see what would drive a meaningful decline in oil prices in the near term.
Technical crude oil forecast: WTI levels to watch
The bullish trend in oil remains firmly intact, given the higher highs and higher lows etc. On the hourly chart, a rising trend line continues to connect the recent lows, with the price action following a familiar pattern: shallow pullbacks, brief periods of consolidation and then another push higher. Resistance levels have been falling one after another.
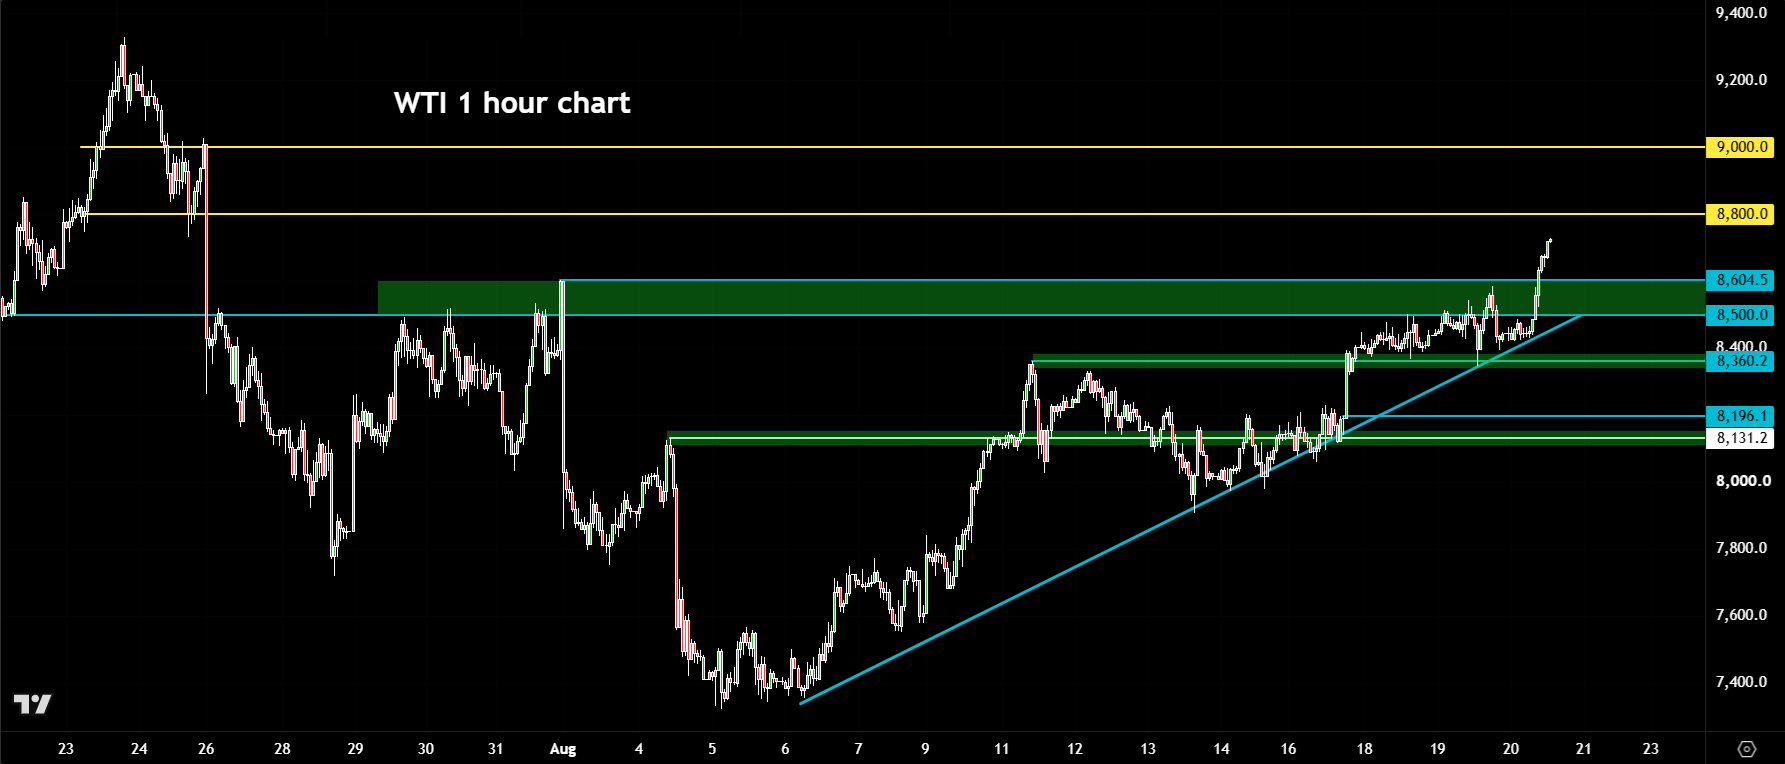
Today, WTI has cleared the $85-$86 resistance area. This was previously a key resistance area on the oil price chart. Now, it could turn into support on any future dips, barring a surprise agreements between the US and Iran to re-open the Strait.
Should we go back below the trend line and support around $85, however, then that could make things interesting. Initial support below that area comes in around $84, followed by $83.60. A break below the latter would weaken the near-term structure and could open the way towards the $82 area, which roughly marks the point of origin of this week’s breakout.
On the topside, attention is now turning to the next round handles like $88 and $89, before the psychologically important $90 mark comes into focus.
-- Written by Fawad Razaqzada, Market Analyst
Follow Fawad on Twitter @Trader_F_R
Related tags:
Latest market news




The complete CFD trading experience
Award-winning platforms, competitive spreads, low commissions and dedicated support.
We live and breathe the markets and are dedicated to helping traders realise their ambitions as we continue to set the industry bar.
Economic calendar
Web Trader platform
Our sophisticated web-based platform is packed with features.
Related articles
Gold, silver slammed as hawkish Fed repricing reignites dollar upside
Gold and silver had held up surprisingly well against surging US yields. Wednesday’s DXY breakout may have changed that equation.
Euro Short-term Outlook: EUR/USD Selloff Nears Critical Yearly Support 9 23 2026
Euro has fallen seven of the past nine sessions, with stretched momentum raising the stakes as EUR/USD closes in on a major inflection zone.


GBP/USD forecast: US dollar surges as bonds implode
The US dollar continued to press higher deep into the European session, supported by the slump in the bond markets as yields broke out across the curve. Following the recent hawkish Fed rate hike, yield spreads between the US and the rest of the world has continually increased, and that motion continued today, helped in part by some forecast-beating US macro data and hawkish Fed commentary.
StoneX Europe Ltd may make third party material available on this website which may contain information included but not limited to the conditions of financial markets. The material is for information purposes only and does not contain, and should not be construed as containing, investment advice and/or investment recommendation and/or an investment research and/or an offer of or solicitation for any transactions in financial instruments; any decision to enter into a specific transaction shall be made by the client following an assessment by him/her of their situation.
StoneX Europe Ltd makes no representation or warranty and assumes no liability as to the accuracy or completeness of the information provided, nor any loss arising from any investment based on a recommendation, forecast or other information supplied. You should always seek independent advice as to your suitability to speculate in any related markets and your ability to assume the associated risks, if you are at all unsure. We are not under any obligation to update any such material. Any opinion made may be personal to the author and may not reflect the opinion of StoneX Europe Ltd.