






December Brings the Volatility
Selling did not start in earnest until the US ISM Manufacturing PMI for November was released
Share this:

Welcome to December! As my colleague Ken Odeluga wrote in our Market Brief, the day had started off pretty well with both the official Chinese PMI (released Saturday) and China’s unofficial measure of manufacturing, the Caixin PMI, both beat expectations. With that, stock indices, the Australian Dollar, and the New Zealand Dollar were all trading higher on the day. Then early in the US session, Trump tweeted that tariffs would be restored on steel and aluminum shipped from Brazil and Argentina to the US. Stocks and the US Dollar both began to sell off. However, the selling did not start in earnest until the US ISM Manufacturing PMI for November was released at 48.1 vs 49.2 expected and 48.3 last. A reading above 50 indicates economic expansion and a reading under 50 indicates economic contraction. November is now the fourth straight month of a reading under 50, and therefore, economic contraction.
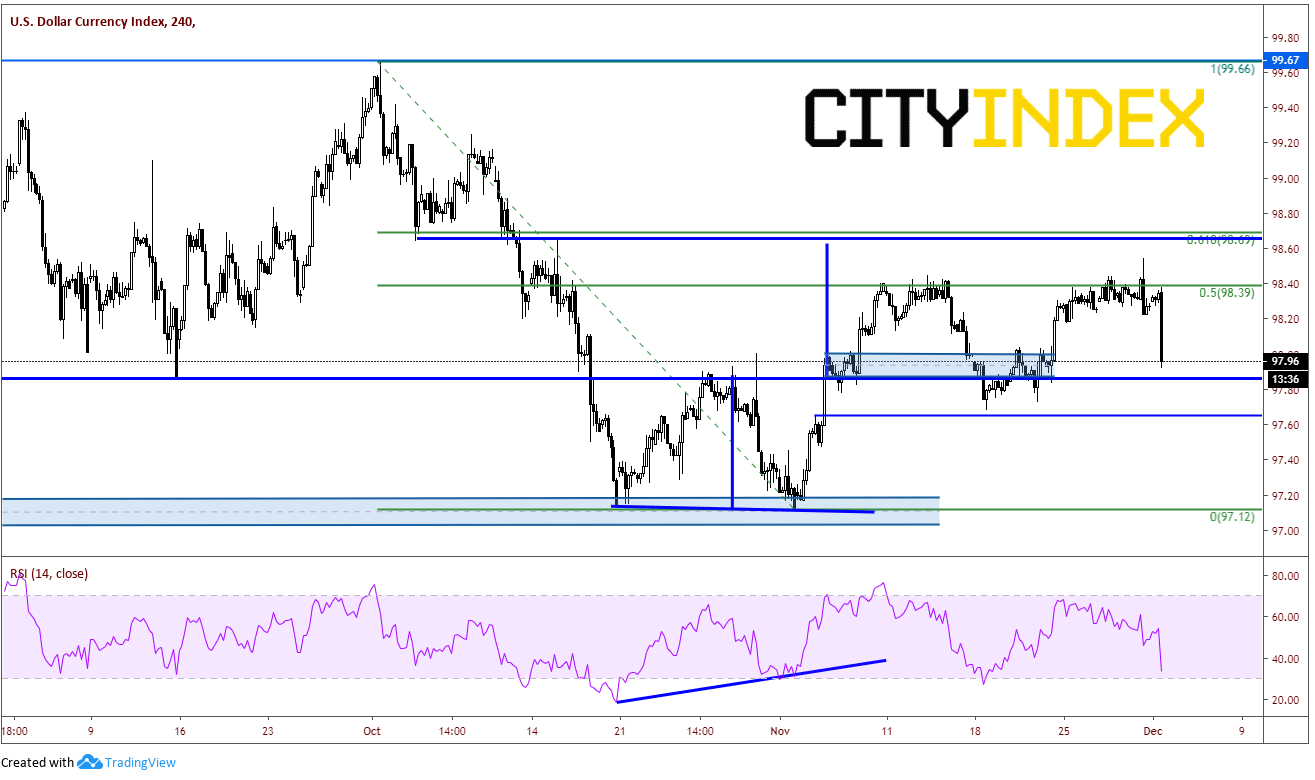
The US Dollar Index has had a difficult time trading about the 50% retracement level from the highs on October 1st to the lows on November 1st. The DXY has been trading near the 98.40 level for a week and could not get a significant move above it. With today’s price action, price moved aggressively lower and is now trading back at support between the 97.85/98.00 area. If price breaks lower through this level, 97.65 may be the next level of support.
Source: Tradingview, City Index
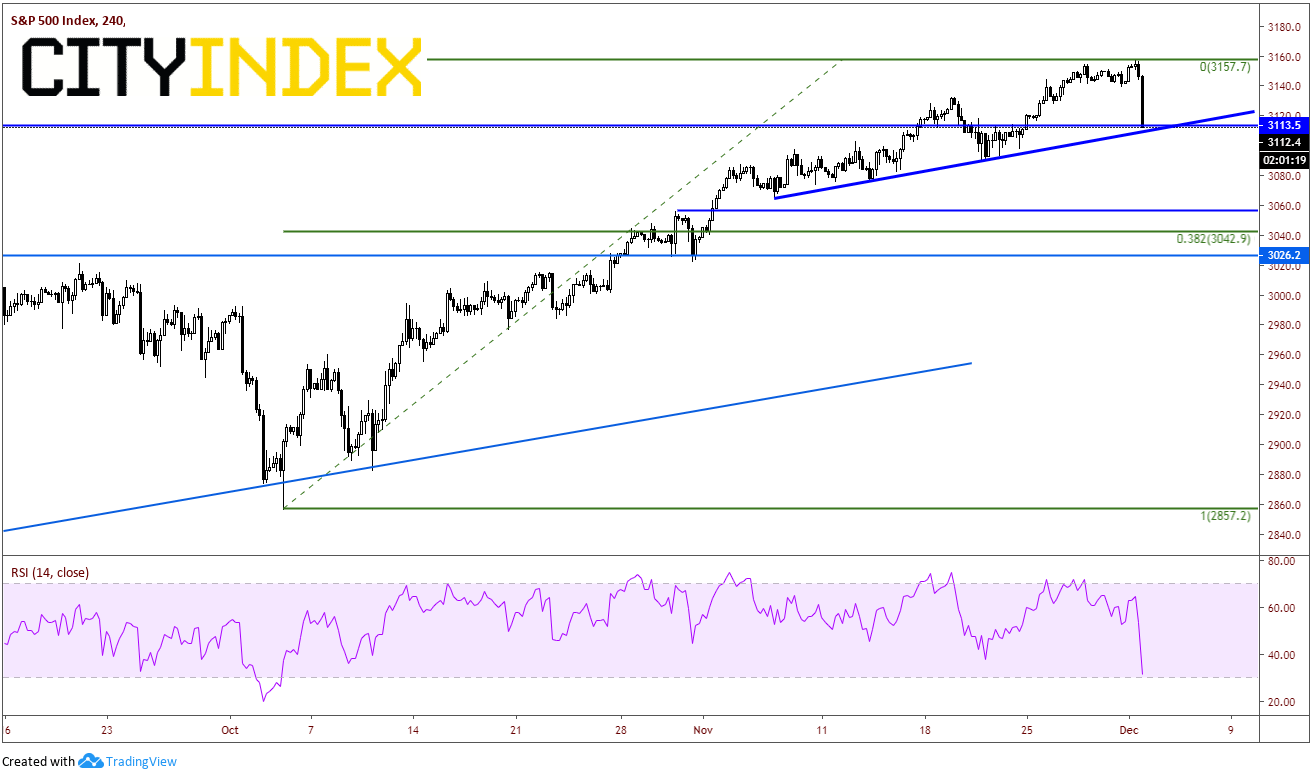
In addition, the S&P 500 Index is down 30 handles as the markets got smashed by the tweets and ISM data. After putting in new all-time highs last week, the index has pulled back and is currently trading near horizonal and trendline support at 3110/3113.
Source: Tradingview, City Index
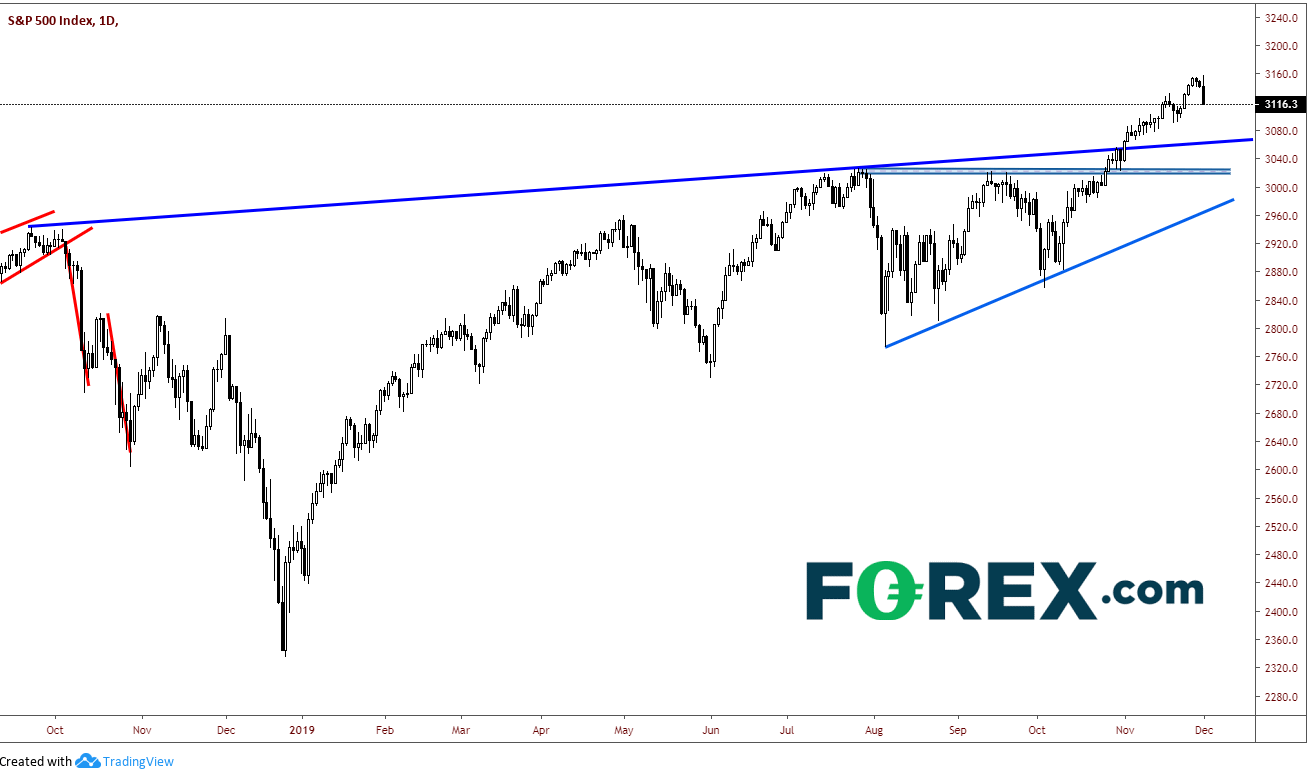
If price breaks below 3110, there is a longer upward sloping trendline dating back to September 2018 which comes across near 3075. Also, if the S&P 500 closes below 3137, a bearish engulfing candle will form and the daily chart.
Source: Tradingview, City Index
Along with the risk off theme of the US session, it’s no surprise that USD/JPY is trading lower. The pair broke through the neckline of the inverse head and shoulders last week, only to see it collapse today and trade back under it. USD/JPY is currently 70 pips off its highs of the day. As with the S&P 500, if the pair closes below 109.40 today, there will be a bearish outside candle, an indication prices may trade lower in the days to come.
Source: Tradingview, City Index
Watch for more tweets from President Trump throughout the day and the week. He does not seem like a President who tolerates a falling stock market. Perhaps a China-US trade deal is almost done, again? And don’t forget NFP on Friday!
December has just begun!!
Welcome to December! As my colleague Ken Odeluga wrote in our Market Brief, the day had started off pretty well with both the official Chinese PMI (released Saturday) and China’s unofficial measure of manufacturing, the Caixin PMI, both beat expectations. With that, stock indices, the Australian Dollar, and the New Zealand Dollar were all trading higher on the day. Then early in the US session, Trump tweeted that tariffs would be restored on steel and aluminum shipped from Brazil and Argentina to the US. Stocks and the US Dollar both began to sell off. However, the selling did not start in earnest until the US ISM Manufacturing PMI for November was released at 48.1 vs 49.2 expected and 48.3 last. A reading above 50 indicates economic expansion and a reading under 50 indicates economic contraction. November is now the fourth straight month of a reading under 50, and therefore, economic contraction.
The US Dollar Index has had a difficult time trading about the 50% retracement level from the highs on October 1st to the lows on November 1st. The DXY has been trading near the 98.40 level for a week and could not get a significant move above it. With today’s price action, price moved aggressively lower and is now trading back at support between the 97.85/98.00 area. If price breaks lower through this level, 97.65 may be the next level of support.
Source: Tradingview, FOREX.com
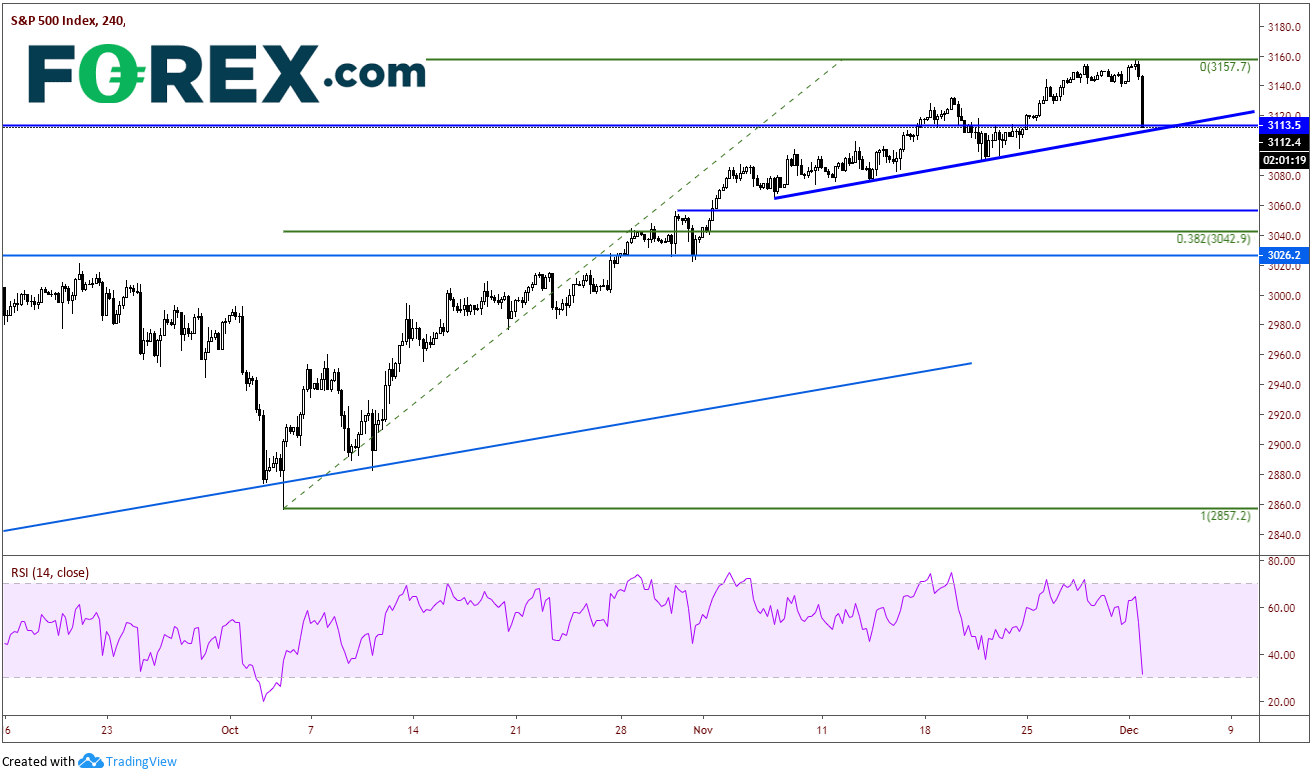
In addition, the S&P 500 Index is down 30 handles as the markets got smashed by the tweets and ISM data. After putting in new all-time highs last week, the index has pulled back and is currently trading near horizonal and trendline support at 3110/3113.
Source: Tradingview, FOREX.com
If price breaks below 3110, there is a longer upward sloping trendline dating back to September 2018 which comes across near 3075. Also, if the S&P 500 closes below 3137, a bearish engulfing candle will form and the daily chart.
Source: Tradingview, FOREX.com
Along with the risk off theme of the US session, it’s no surprise that USD/JPY is trading lower. The pair broke through the neckline of the inverse head and shoulders last week, only to see it collapse today and trade back under it. USD/JPY is currently 70 pips off its highs of the day. As with the S&P 500, if the pair closes below 109.40 today, there will be a bearish outside candle, an indication prices may trade lower in the days to come.
Source: Tradingview, FOREX.com
Watch for more tweets from President Trump throughout the day and the week. He does not seem like a President who tolerates a falling stock market. Perhaps a China-US trade deal is almost done, again? And don’t forget NFP on Friday!
December has just begun!!
Latest market news




The complete CFD trading experience
Award-winning platforms, competitive spreads, low commissions and dedicated support.
We live and breathe the markets and are dedicated to helping traders realise their ambitions as we continue to set the industry bar.
Economic calendar
Web Trader platform
Our sophisticated web-based platform is packed with features.
Related articles
Australian Dollar Technical Outlook: AUD/USD Breakdown Threatens Deeper Correction 9 23 2026
AUD/USD remains under pressure after breaking key trend support, with the latest decline putting the focus on the next major downside pivot.

USD/JPY forecast: US dollar strengths amid hawkish Fed despite recent oil weakness
The US dollar has extended its gains this morning, even if oil prices finished lower for the fifth consecutive day yesterday. Oil prices have bounced back in this first half of today’s session, causing a bit of pressure on currencies that rely on energy imports such as the euro, pound, Swiss franc, and Japanese yen. But it was the dollar that was exerting the most pressure, amid hawkish FedSpeak. Meanwhile, European indices and precious metals were also under a bit of pressure amid the strength of the dollar.


EUR/AUD, GBP/AUD Outlook: Rates, risk and metals reinforce bearish technical case
EUR/AUD and GBP/AUD are coiling near support, with recent correlations suggesting the Aussie’s strength is being driven more by rates, risk and metals than energy.

StoneX Europe Ltd may make third party material available on this website which may contain information included but not limited to the conditions of financial markets. The material is for information purposes only and does not contain, and should not be construed as containing, investment advice and/or investment recommendation and/or an investment research and/or an offer of or solicitation for any transactions in financial instruments; any decision to enter into a specific transaction shall be made by the client following an assessment by him/her of their situation.
StoneX Europe Ltd makes no representation or warranty and assumes no liability as to the accuracy or completeness of the information provided, nor any loss arising from any investment based on a recommendation, forecast or other information supplied. You should always seek independent advice as to your suitability to speculate in any related markets and your ability to assume the associated risks, if you are at all unsure. We are not under any obligation to update any such material. Any opinion made may be personal to the author and may not reflect the opinion of StoneX Europe Ltd.