







End of Year US Dollar Selloff Continues to Drive FX Markets
Many of the US Dollar moves continue to be exaggerated.
Share this:

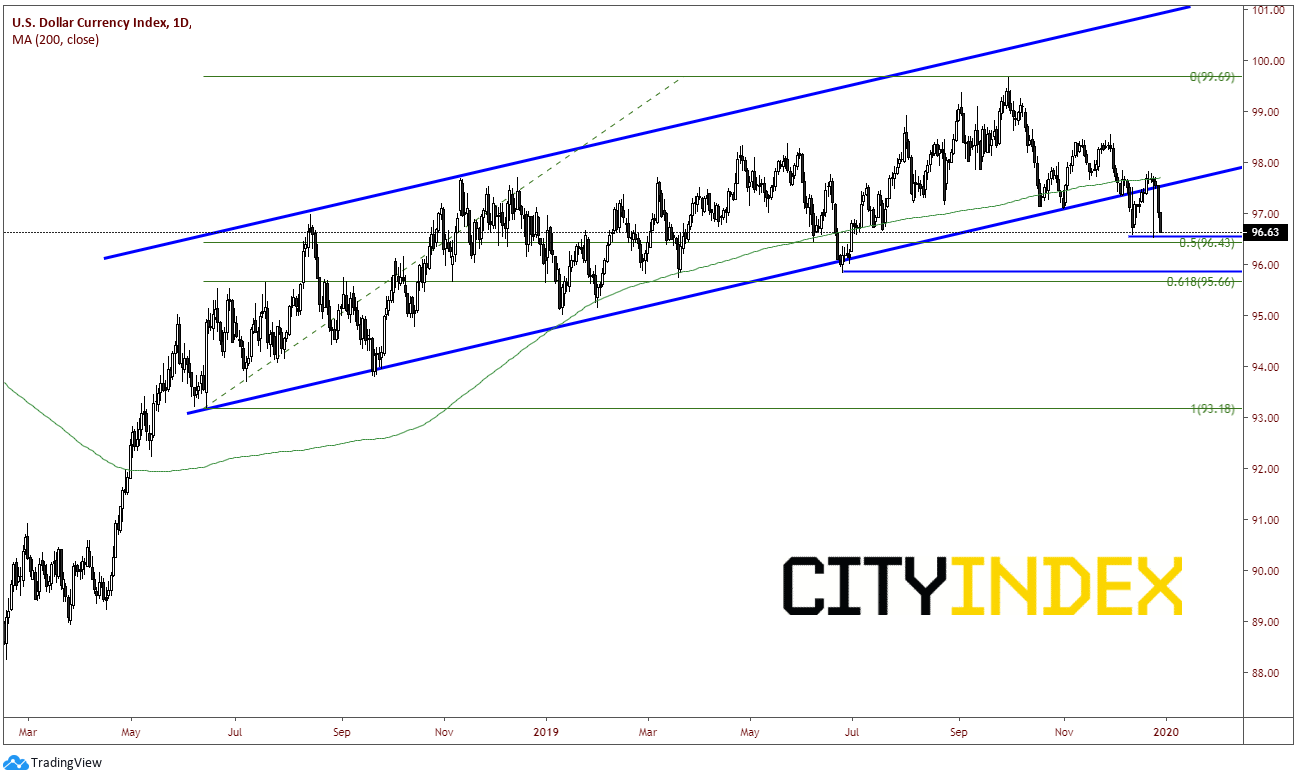
On Friday, the DXY was down over 0.6% and today to selloff continues. Price today is down nearly another 0.4% in US trading as the DXY looks to test the spike lows from the Christmas night (in US session). Price is diverging on a short-term time frame; however, yearend flows will dominate and technical won’t be as relevant if people need to get things done for end of year.
Source: Tradingview, City Index
Even though technicals may not be as important when funds need to get things done, it is still important to look for areas where price may pause or reverse. DXY is well underneath the upward channel it has been in since mid-2018. If DXY breaks through recent spike lows, the next level is the 50% retracement level from the June 2018 lows to the highs on September 30th of this year at 96.43. Below that is a zone for support between the 61.8% retracement of the same time period and horizonal support, between 95.66 and 95.84. Resistance is back at the upward sloping channel line near 97.50.
Source: Tradingview, City Index
As a result, many of the US Dollar counter currencies are continuing to trade higher.
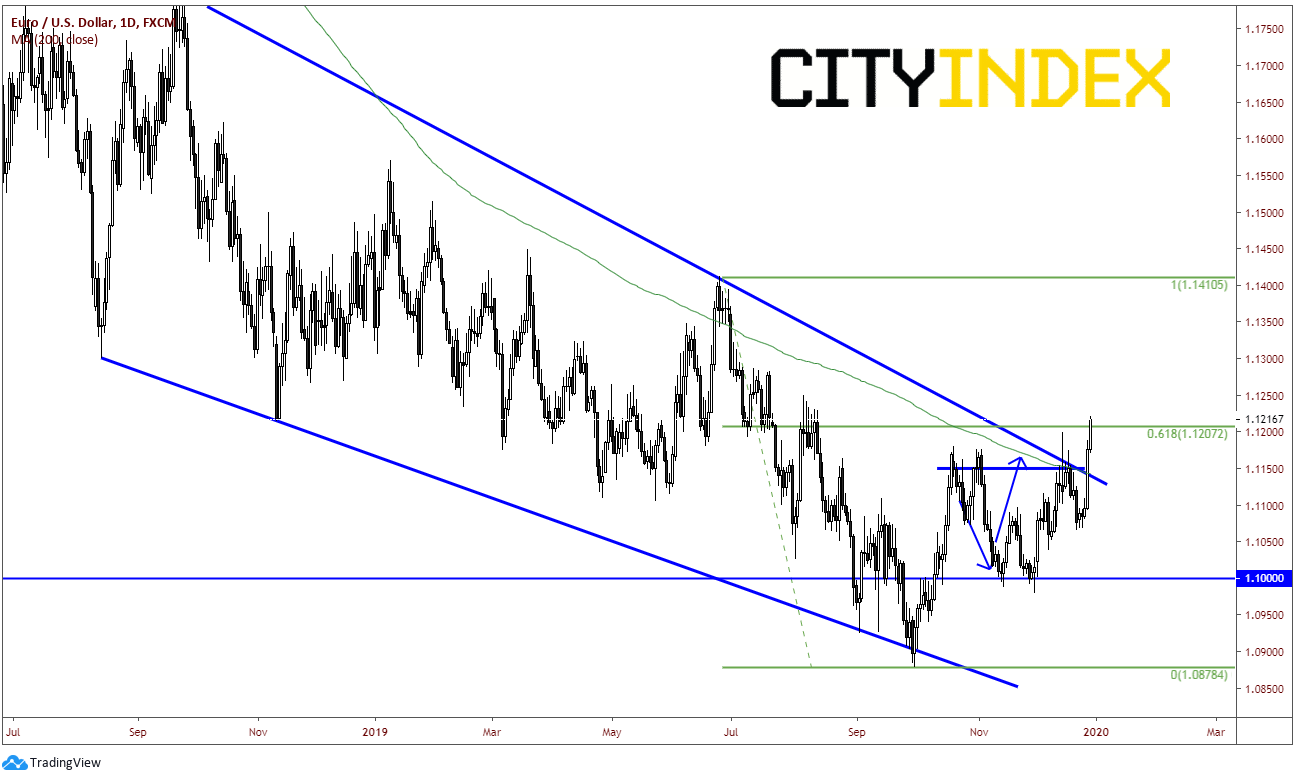
EUR/USD has broken decisively above 1.1200 and the 61.8% retracement level from the June highs to the September 30th lows at 1.1207. If this move continues, price can easily run up to 1.1350.
Source: Tradingview, City Index
USD/CHF twice failed to take out the 61.8% retracement level from the April 25th highs to the august 12th lows and put in a double top. Price is moving towards the target of the double top near .9640 and well as the August 12th lows near .9663.
Source: Tradingview, City Index
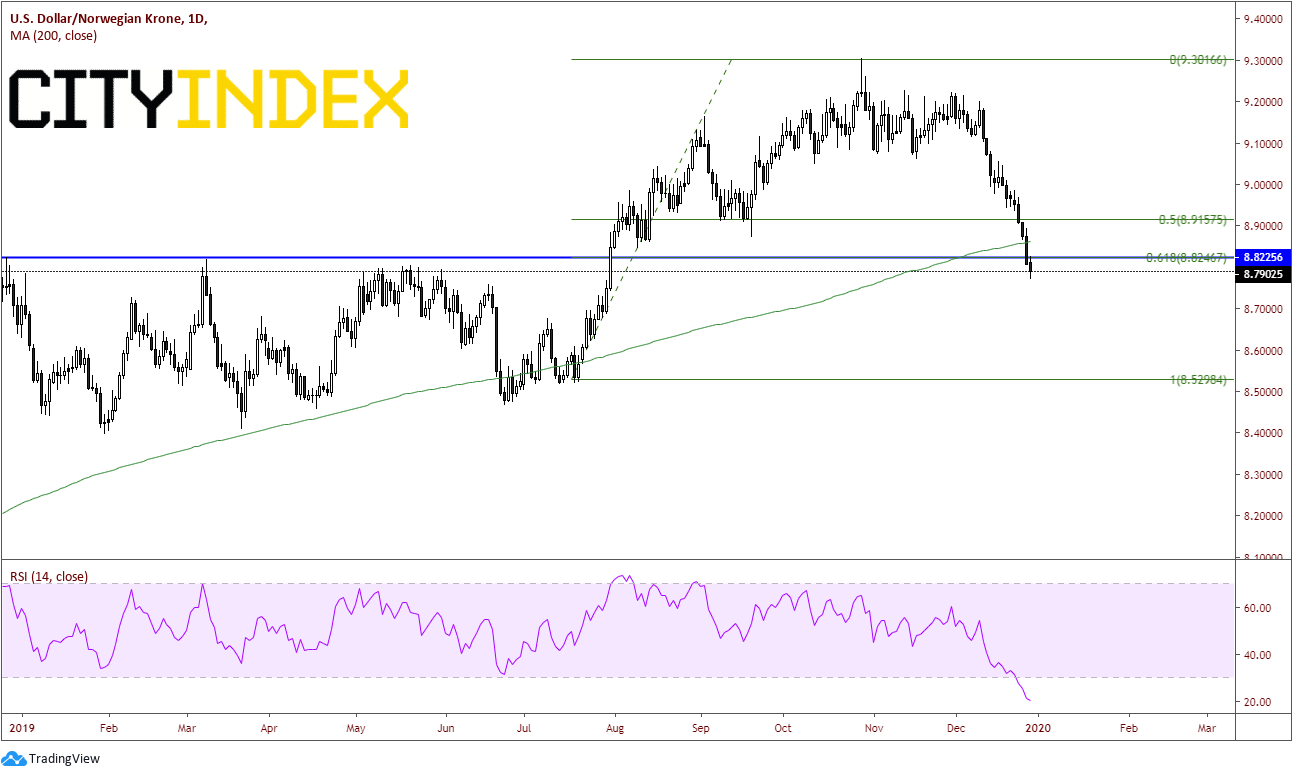
Commodity currencies have been hit as well vs the US Dollar, with USD/NOK being on of the hardest hit over the last few weeks. The bid is the Norwegian Krone has been hit by a double whammy of a weak US Dollar and strong oil. Price has fallen from a high of 9.1846 on December 12th to current levels near 8.7894. Along the way, and pair has broken the 200-day moving average, horizontal support and the 61.8% retracement of the move from the low on July 19th to the highs on December 12th. The RSI is in oversold territory.
Source: Tradingview, City Index
Note the Australian Dollar, the New Zealand Dollar and the Canadian Dollar are also testing to putting in new recent highs vs the US Dollar as well.
It is important to remember that until the market reopens January 2nd, these appear to be year end flows. Many of the US Dollar moves continue to be exaggerated. The technicals mentioned here will become more useful once we enter the new year.
On Friday, the DXY was down over 0.6% and today to selloff continues. Price today is down nearly another 0.4% in US trading as the DXY looks to test the spike lows from the Christmas night (in US session). Price is diverging on a short-term time frame; however, yearend flows will dominate and technical won’t be as relevant if people need to get things done for end of year.
Source: Tradingview, FOREX.com
Even though technicals may not be as important when funds need to get things done, it is still important to look for areas where price may pause or reverse. DXY is well underneath the upward channel it has been in since mid-2018. If DXY breaks through recent spike lows, the next level is the 50% retracement level from the June 2018 lows to the highs on September 30th of this year at 96.43. Below that is a zone for support between the 61.8% retracement of the same time period and horizonal support, between 95.66 and 95.84. Resistance is back at the upward sloping channel line near 97.50.
Source: Tradingview, FOREX.com
As a result, many of the US Dollar counter currencies are continuing to trade higher.
EUR/USD has broken decisively above 1.1200 and the 61.8% retracement level from the June highs to the September 30th lows at 1.1207. If this move continues, price can easily run up to 1.1350.
Source: Tradingview, FOREX.com
USD/CHF twice failed to take out the 61.8% retracement level from the April 25th highs to the august 12th lows and put in a double top. Price is moving towards the target of the double top near .9640 and well as the August 12th lows near .9663.
Source: Tradingview, FOREX.com
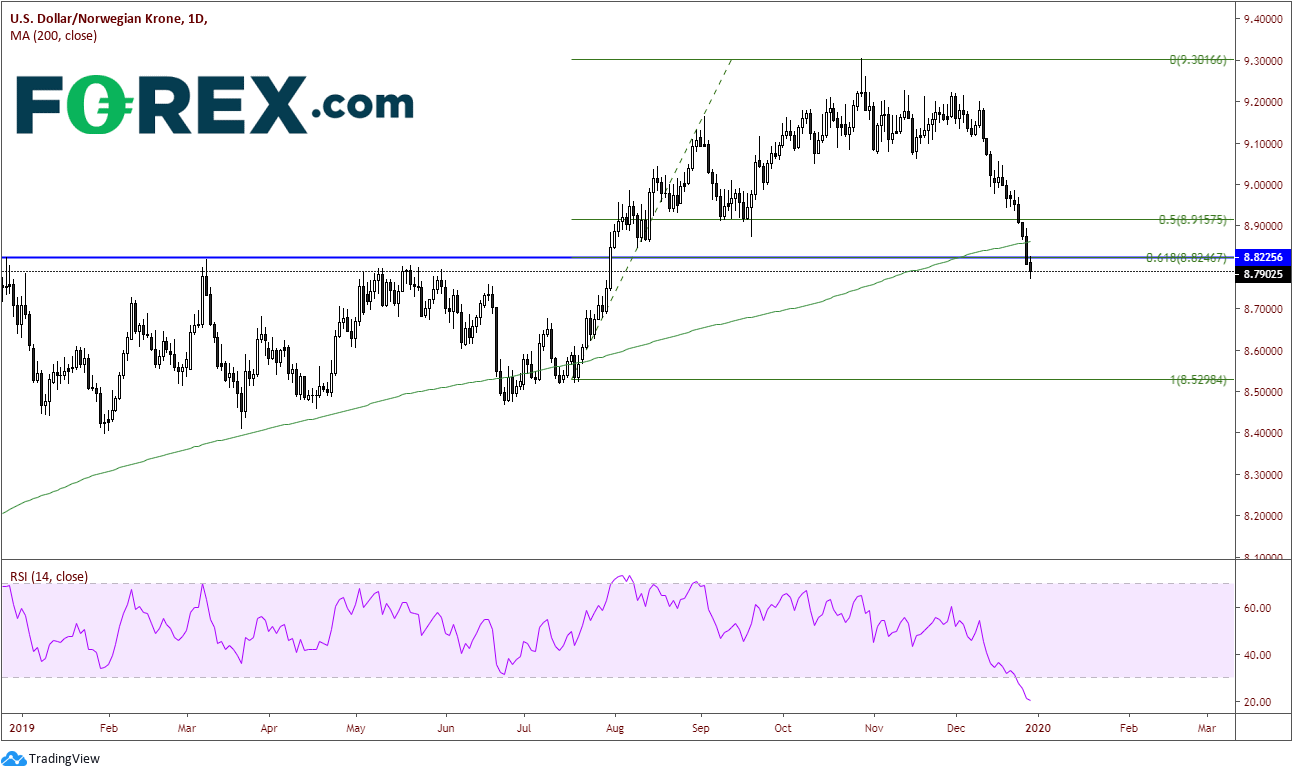
Commodity currencies have been hit as well vs the US Dollar, with USD/NOK being on of the hardest hit over the last few weeks. The bid is the Norwegian Krone has been hit by a double whammy of a weak US Dollar and strong oil. Price has fallen from a high of 9.1846 on December 12th to current levels near 8.7894. Along the way, and pair has broken the 200-day moving average, horizontal support and the 61.8% retracement of the move from the low on July 19th to the highs on December 12th. The RSI is in oversold territory.
Source: Tradingview, FOREX.com
Note the Australian Dollar, the New Zealand Dollar and the Canadian Dollar are also testing to putting in new recent highs vs the US Dollar as well.
It is important to remember that until the market reopens January 2nd, these appear to be year end flows. Many of the US Dollar moves continue to be exaggerated. The technicals mentioned here will become more useful once we enter the new year.



The complete CFD trading experience
Award-winning platforms, competitive spreads, low commissions and dedicated support.
We live and breathe the markets and are dedicated to helping traders realise their ambitions as we continue to set the industry bar.
Economic calendar
Web Trader platform
Our sophisticated web-based platform is packed with features.
Related articles

USD/JPY forecast: US dollar strengths amid hawkish Fed despite recent oil weakness
The US dollar has extended its gains this morning, even if oil prices finished lower for the fifth consecutive day yesterday. Oil prices have bounced back in this first half of today’s session, causing a bit of pressure on currencies that rely on energy imports such as the euro, pound, Swiss franc, and Japanese yen. But it was the dollar that was exerting the most pressure, amid hawkish FedSpeak. Meanwhile, European indices and precious metals were also under a bit of pressure amid the strength of the dollar.


EUR/AUD, GBP/AUD Outlook: Rates, risk and metals reinforce bearish technical case
EUR/AUD and GBP/AUD are coiling near support, with recent correlations suggesting the Aussie’s strength is being driven more by rates, risk and metals than energy.


EUR/USD Update: Will Fed Expectations Keep Pressure on the Euro?
The week continues to present challenges for the euro's short-term strength. This is reflected in the recent performance of EUR/USD, which has declined by nearly 0.6% over the last three trading sessions

StoneX Europe Ltd may make third party material available on this website which may contain information included but not limited to the conditions of financial markets. The material is for information purposes only and does not contain, and should not be construed as containing, investment advice and/or investment recommendation and/or an investment research and/or an offer of or solicitation for any transactions in financial instruments; any decision to enter into a specific transaction shall be made by the client following an assessment by him/her of their situation.
StoneX Europe Ltd makes no representation or warranty and assumes no liability as to the accuracy or completeness of the information provided, nor any loss arising from any investment based on a recommendation, forecast or other information supplied. You should always seek independent advice as to your suitability to speculate in any related markets and your ability to assume the associated risks, if you are at all unsure. We are not under any obligation to update any such material. Any opinion made may be personal to the author and may not reflect the opinion of StoneX Europe Ltd.