



EU CPI comes in much higher than expected
CPI out of the Eurozone was high and the Russia/Ukraine conflict should only make it increase due to soaring energy costs.
Share this:

The main driver of currencies this week has been the Russian invasion into Ukraine. However, traders can’t overlook the most important piece of economic data when it comes to interest rates: inflation. After the stronger than expected harmonized readings for February CPI from Germany, Italy, Spain, and France, it’s not surprising that the headline print for the Eurozone Flash CPI was stronger than expected. The reading was 5.8% YoY vs 5.4% YoY expected and 5.1% YoY in January! This was a record high for Euro Zone CPI. Core CPI, which excludes energy, food, alcohol and tobacco, was up 2.7% YoY vs 2.5% YoY expected and 2.3% YoY in January.
It should be noted that the ECB targets 2% inflation and that February’s increase was before energy prices began to skyrocket because of the Russia/Ukraine conflict. Will continued high CPI cause the ECB to move up it’s timeline for decreasing asset purchases, or even allow the markets to look for a rate hike sooner than the end of year?
ECB’s de Guindos said earlier today that the invasion of Ukraine by Russia will not only have an impact on the economy in the Eurozone, but it will also have an impact on inflation. Therefore, it would seem, that de Guindos is expecting inflation to continue to rise. The next ECB interest rated decision meeting is next week
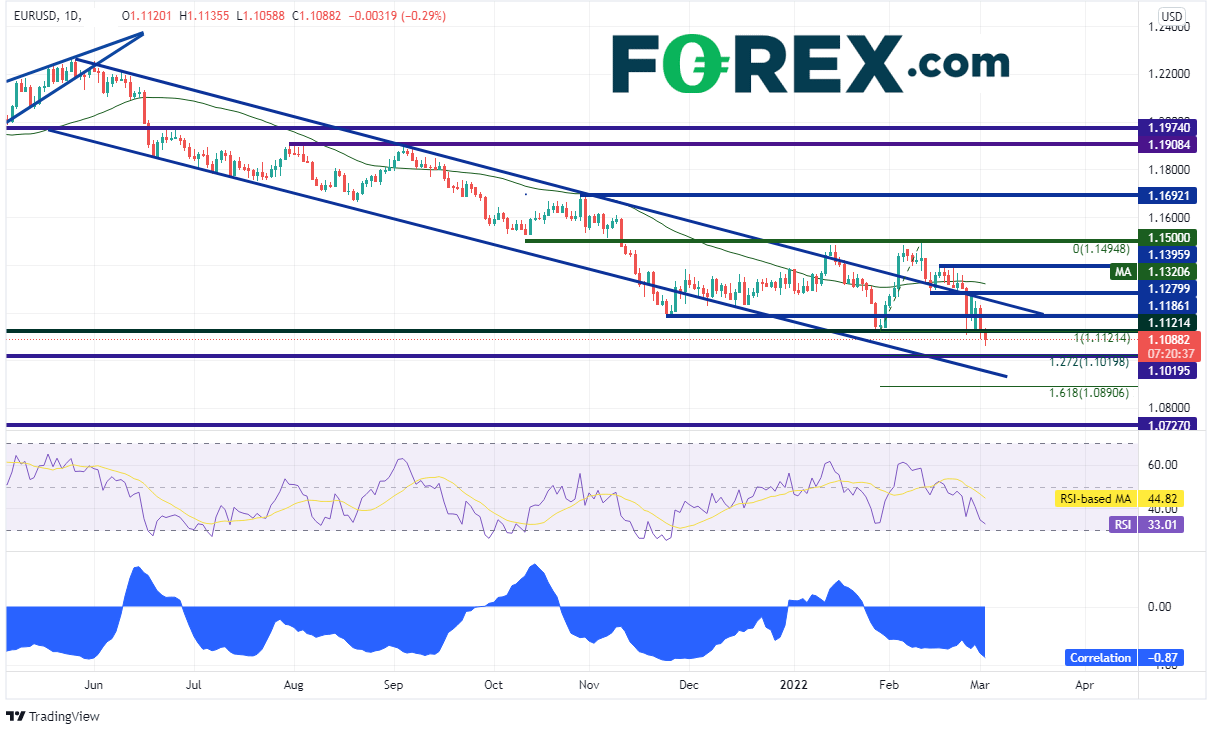
EUR/USD has been moving lower in a downward sloping channel since May 2021. Today, the pair reached its lowest level since May 2020, near 1.1059. Notice that the correlation coefficient between the EUR/USD and USD/RUB is -0.87. A correlation coefficient of -1.00 means that there is a perfectly negative correlation between the 2 assets and that they move In opposite directions 100% of the time. A reading below -0.80 is considered a strong negative correlation. Therefore, if USD/RUB continues to move higher, one can expect EUR/USD to continue to move lower.
Source: Tradingview, Stone X
On a 240- minute timeframe, price has moved convincingly below the January 28th lows and is threatening the 127.2% Fibonacci extension from those lows to the highs from February 10th, near 1.1020. Horizontal support from April 2020 also sits that that level. Below there is the bottom trendline of the long-term channel near 1.0950, then the 161.8% Fibonacci retracement from the recently mentioned timeframe near 1.0890.

Source: Tradingview, Stone X
However, EUR/USD is trading in a descending wedge. Expectations are that price will break out to the upside of the wedge. The target is a 100% retracement of the wedge. In addition, the RSI is diverging with price, an indication that EUR/USD may move higher. Resistance is at the previous support level of 1.1121, then the top trendline of the long-term channel (near the highs of the wedge) near 1.1250. Horizontal resistance sits just above there at 1.1280.
CPI out of the Eurozone was high and the Russia/Ukraine conflict should only make it increase due to soaring energy costs. Traders need to consider whether this will be enough for the ECB to make changes to their asset purchase plan when then meet next week.
The main driver of currencies this week has been the Russian invasion into Ukraine. However, traders can’t overlook the most important piece of economic data when it comes to interest rates: inflation. After the stronger than expected harmonized readings for February CPI from Germany, Italy, Spain, and France, it’s not surprising that the headline print for the Eurozone Flash CPI was stronger than expected. The reading was 5.8% YoY vs 5.4% YoY expected and 5.1% YoY in January! This was a record high for Euro Zone CPI. Core CPI, which excludes energy, food, alcohol and tobacco, was up 2.7% YoY vs 2.5% YoY expected and 2.3% YoY in January.
It should be noted that the ECB targets 2% inflation and that February’s increase was before energy prices began to skyrocket because of the Russia/Ukraine conflict. Will continued high CPI cause the ECB to move up it’s timeline for decreasing asset purchases, or even allow the markets to look for a rate hike sooner than the end of year?
ECB’s de Guindos said earlier today that the invasion of Ukraine by Russia will not only have an impact on the economy in the Eurozone, but it will also have an impact on inflation. Therefore, it would seem, that de Guindos is expecting inflation to continue to rise. The next ECB interest rated decision meeting is next week.
Trade EUR/USD now: Login or Open a new account!
• Open an account in the UK
• Open an account in Australia
• Open an account in Singapore
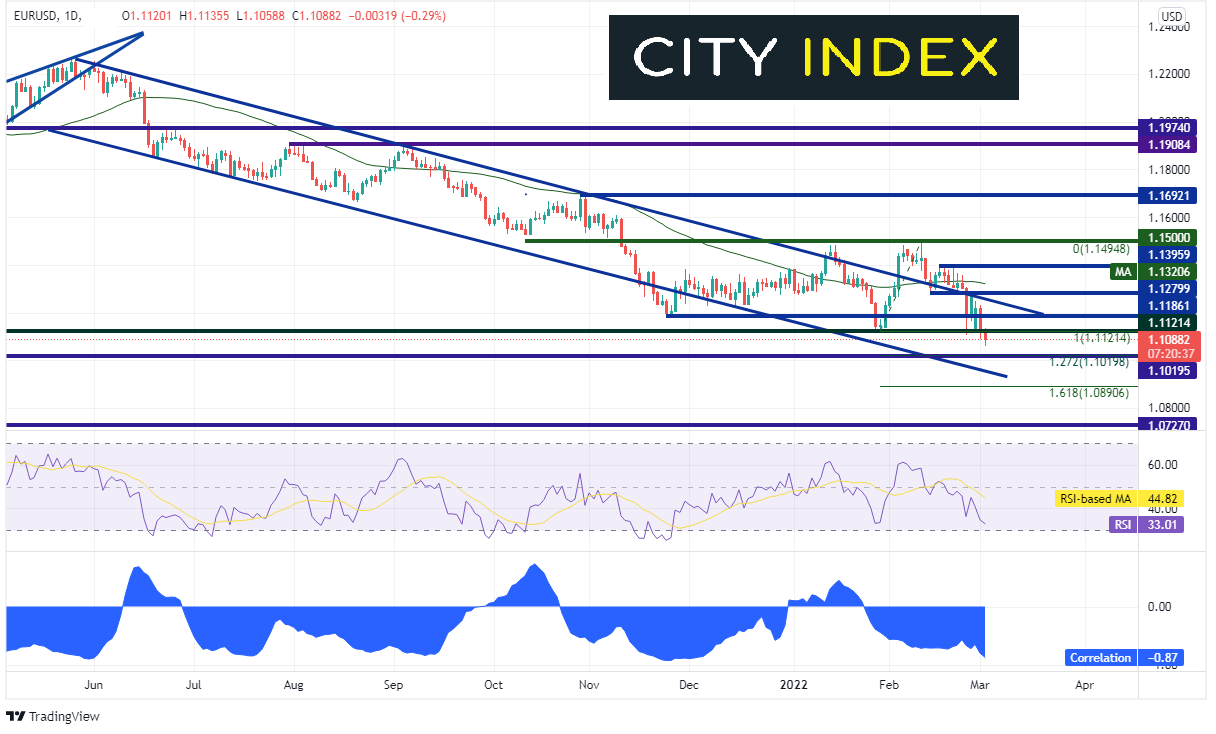
EUR/USD has been moving lower in a downward sloping channel since May 2021. Today, the pair reached its lowest level since May 2020, near 1.1059. Notice that the correlation coefficient between the EUR/USD and USD/RUB is -0.87. A correlation coefficient of -1.00 means that there is a perfectly negative correlation between the 2 assets and that they move In opposite directions 100% of the time. A reading below -0.80 is considered a strong negative correlation. Therefore, if USD/RUB continues to move higher, one can expect EUR/USD to continue to move lower.
Source: Tradingview, Stone X
On a 240- minute timeframe, price has moved convincingly below the January 28th lows and is threatening the 127.2% Fibonacci extension from those lows to the highs from February 10th, near 1.1020. Horizontal support from April 2020 also sits that that level. Below there is the bottom trendline of the long-term channel near 1.0950, then the 161.8% Fibonacci retracement from the recently mentioned timeframe near 1.0890.

Source: Tradingview, Stone X
However, EUR/USD is trading in a descending wedge. Expectations are that price will break out to the upside of the wedge. The target is a 100% retracement of the wedge. In addition, the RSI is diverging with price, an indication that EUR/USD may move higher. Resistance is at the previous support level of 1.1121, then the top trendline of the long-term channel (near the highs of the wedge) near 1.1250. Horizontal resistance sits just above there at 1.1280.
CPI out of the Eurozone was high and the Russia/Ukraine conflict should only make it increase due to soaring energy costs. Traders need to consider whether this will be enough for the ECB to make changes to their asset purchase plan when then meet next week.
Learn more about forex trading opportunities.
Related tags:
Latest market news




The complete CFD trading experience
Award-winning platforms, competitive spreads, low commissions and dedicated support.
We live and breathe the markets and are dedicated to helping traders realise their ambitions as we continue to set the industry bar.
Economic calendar
Web Trader platform
Our sophisticated web-based platform is packed with features.
Related articles
British Pound Technical Outlook: GBP/USD Rebound Challenges September Downtrend 9 30 2026
Sterling has rallied sharply from key support, with GBP/USD at an inflection point that could determine whether a larger recovery is underway.

EUR/USD forecast: Eurozone stagflation risks mount as dollar holds firm ahead of data
The dollar was bouncing back at the time of writing, after it had eased overnight on the back of some weaker-than-expected economic data yesterday which had prompted markets to scale back expectations of an October Fed rate hike. However, with more significant US data due today and Friday, and with oil prices continuing to remain elevated, the dollar’s broader direction remains bullish.


NZD/USD pressure mounts as payrolls looms large
NZD/USD has fallen sharply as Fed rate expectations reset higher, but extreme downside stretch and major support raise the risk of a violent counter-trend rebound.

StoneX Europe Ltd may make third party material available on this website which may contain information included but not limited to the conditions of financial markets. The material is for information purposes only and does not contain, and should not be construed as containing, investment advice and/or investment recommendation and/or an investment research and/or an offer of or solicitation for any transactions in financial instruments; any decision to enter into a specific transaction shall be made by the client following an assessment by him/her of their situation.
StoneX Europe Ltd makes no representation or warranty and assumes no liability as to the accuracy or completeness of the information provided, nor any loss arising from any investment based on a recommendation, forecast or other information supplied. You should always seek independent advice as to your suitability to speculate in any related markets and your ability to assume the associated risks, if you are at all unsure. We are not under any obligation to update any such material. Any opinion made may be personal to the author and may not reflect the opinion of StoneX Europe Ltd.