




EURGBP Testing 2019 Lows
With today’s price action in Euro and Sterling, the next pair to look at is EUR/GBP.
Share this:

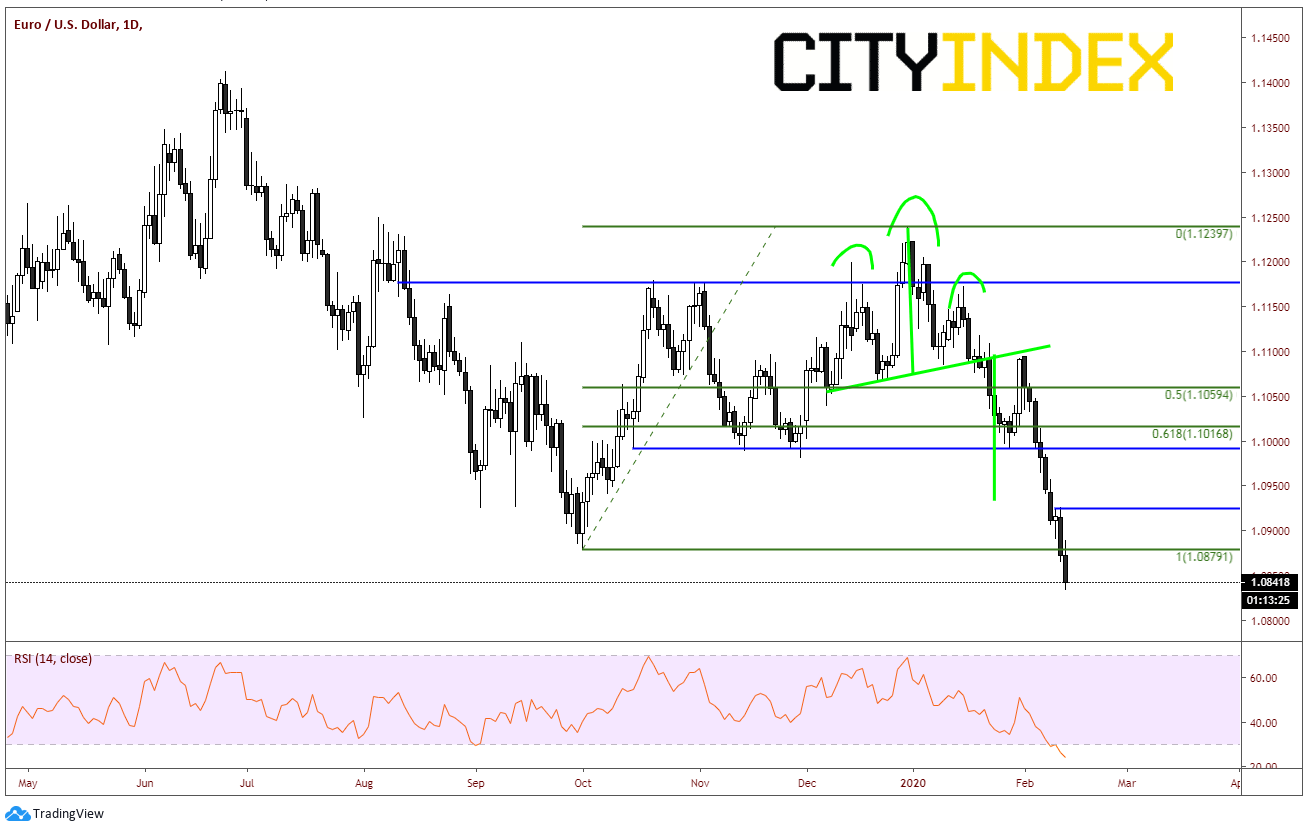
EUR/USD has been down 8 of the last 9 trading days, and the 1 day it closed higher, it was only up 4 pips! Once the pair broke the neckline of the head and shoulders pattern last week, if was off to the races. Price has traded from 1.1094 down to today’s lows near 1.0834, which hasn’t been seen since May 2017.
Source: Tradingview, City Index
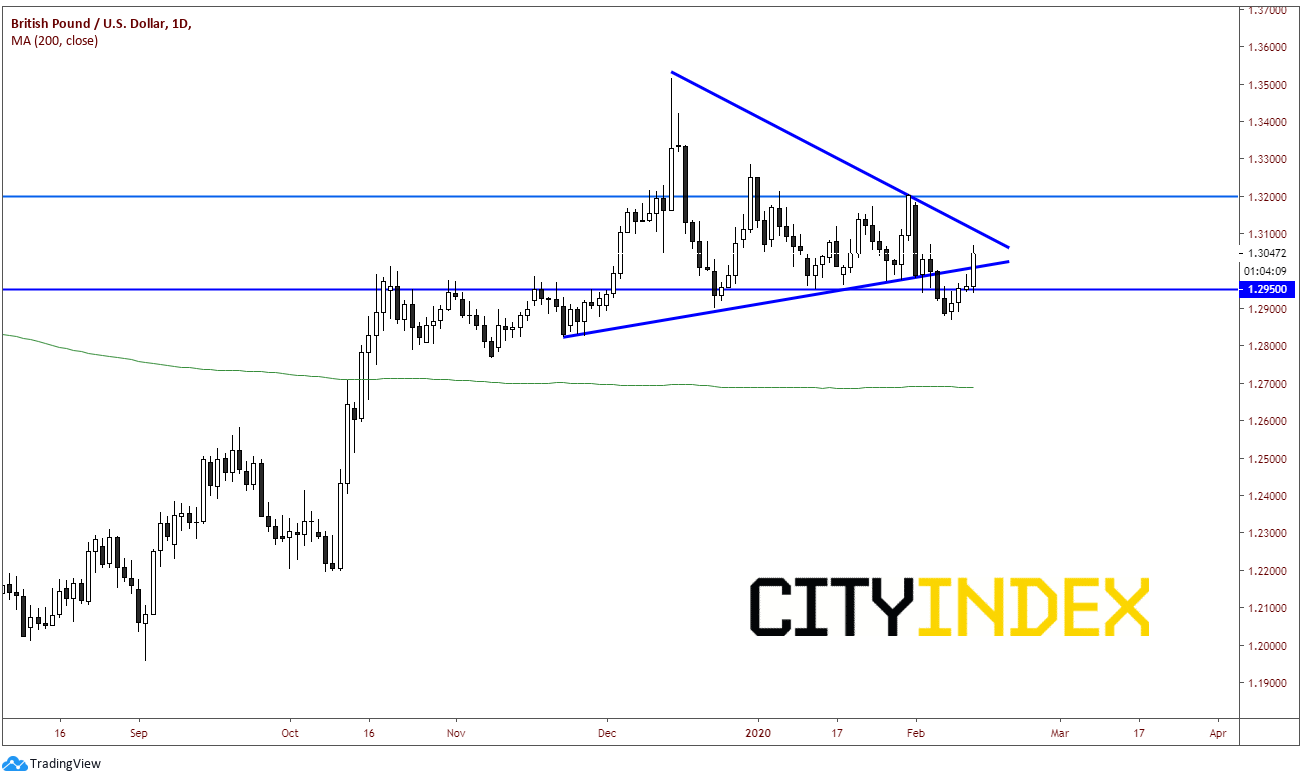
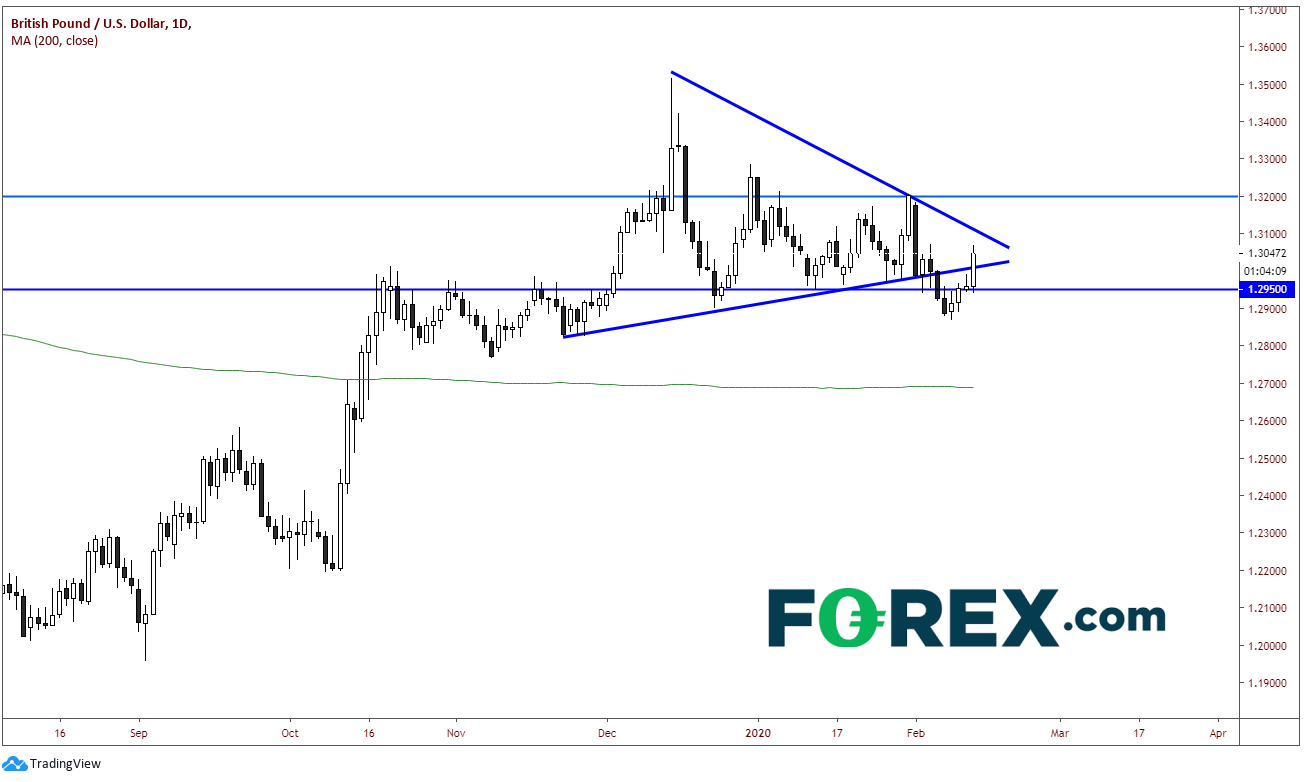
Since election day on December 13th, 2019, GBP/USD has been trading in a symmetrical triangle. Price hadn’t done too much until last week when it tried to break lower from near the apex of the triangle, only to have that be a false breakdown and trade back into the apex today. Prime Minister Boris Johnson replaced Finance Minister Sajid David with Rishi Sunak, who traders believe will be more likely to induce more fiscal stimulus into the economy. This caused GBP/USD to go bid.
Source: Tradingview, City Index
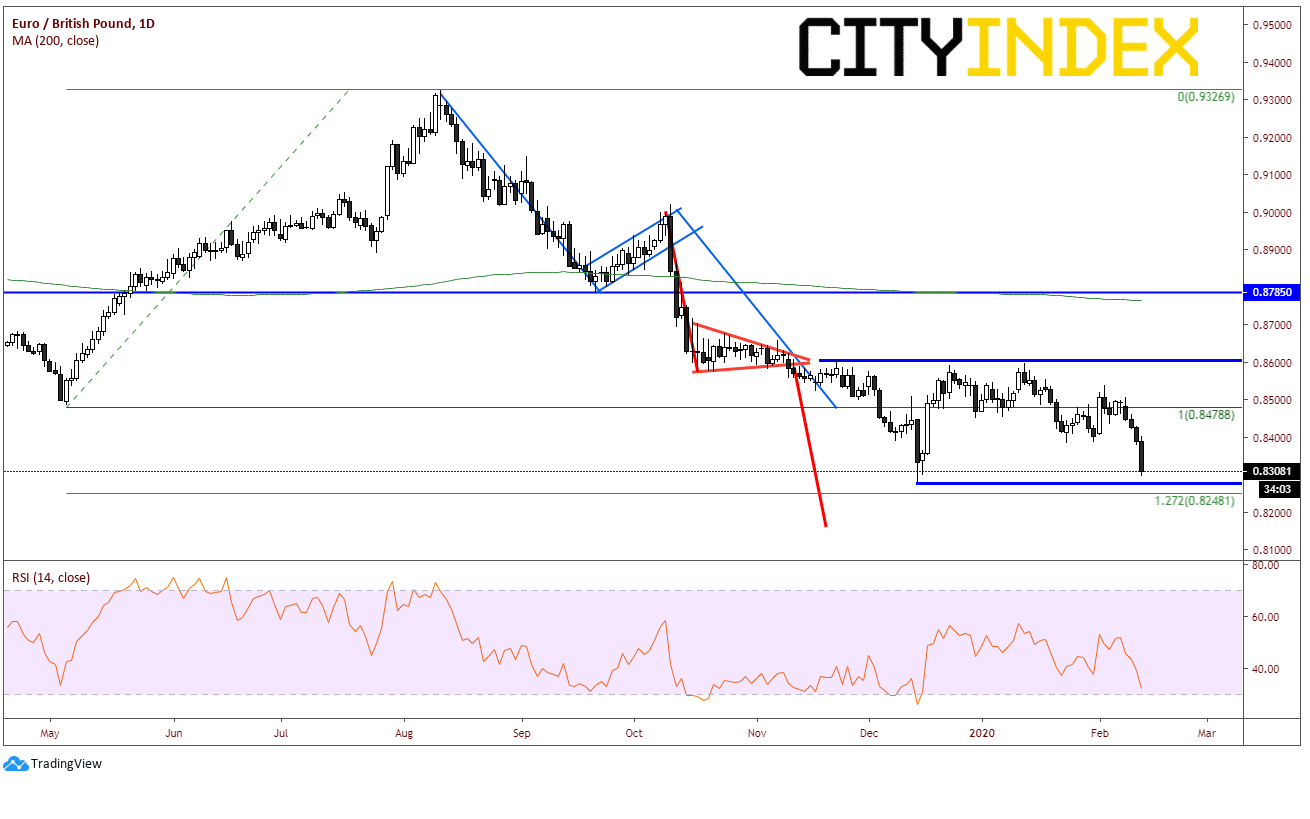
With today’s price action in the Euro (lower) and Pound (higher), it seems logical that the next pair one would look at would be EUR/GBP, which is down almost 1% on the day. Technically, the pair has been trading nicely since August 2019, completing a flag pattern (blue) and almost reaching target (close enough for horseshoes) of a pennant pattern (orange). EUR/GBP reached a low of .8275 on UK election day, which was the low of the year for the pair. Price then bounced. However, with the Euro lower and the Pound stronger today, price is nearing the election lows once again. Price is currently trading near .8305. The first support for EUR/GBP is the .8275 level. Below that is the 127.2% Fibonacci extension level from the lows of May 8th, 2019 to the highs on August 12th, 2019 which is .8248. And although the previous mentioned pennant was almost reached, it once again is on our radar near .8165.
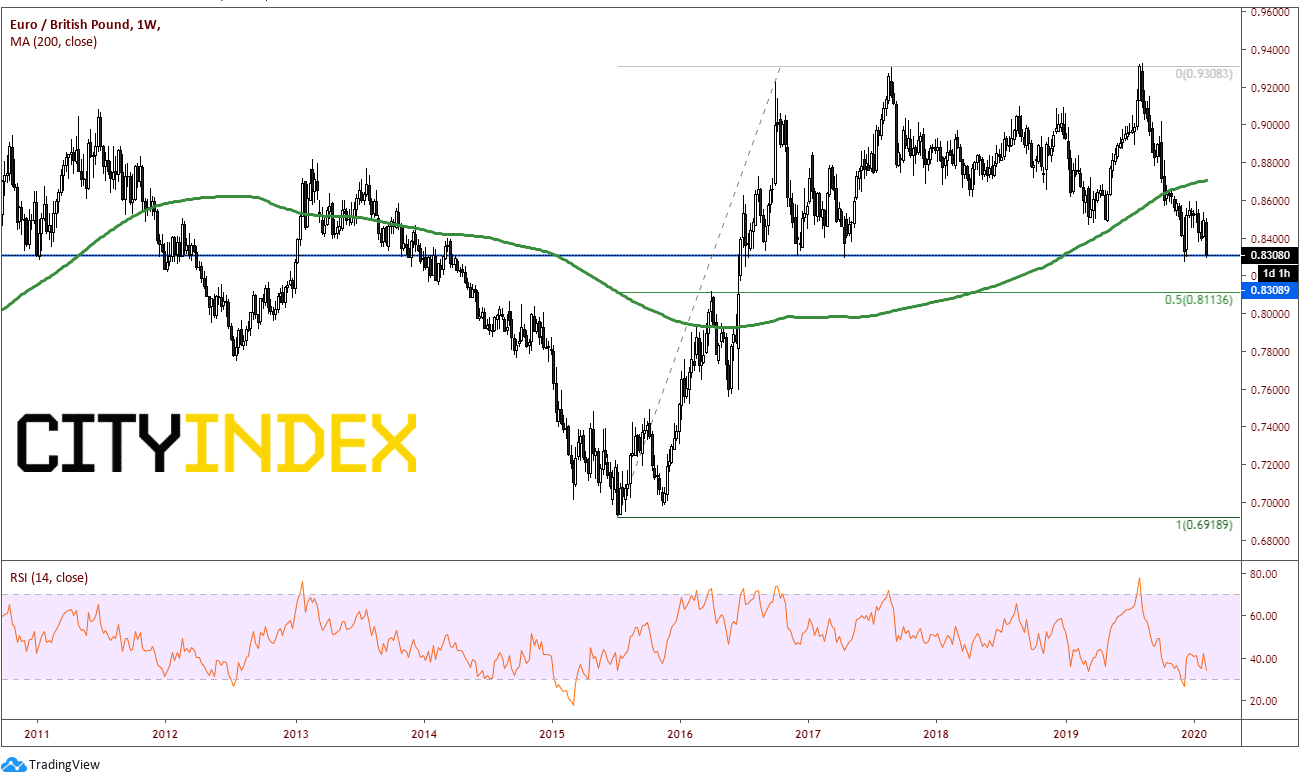
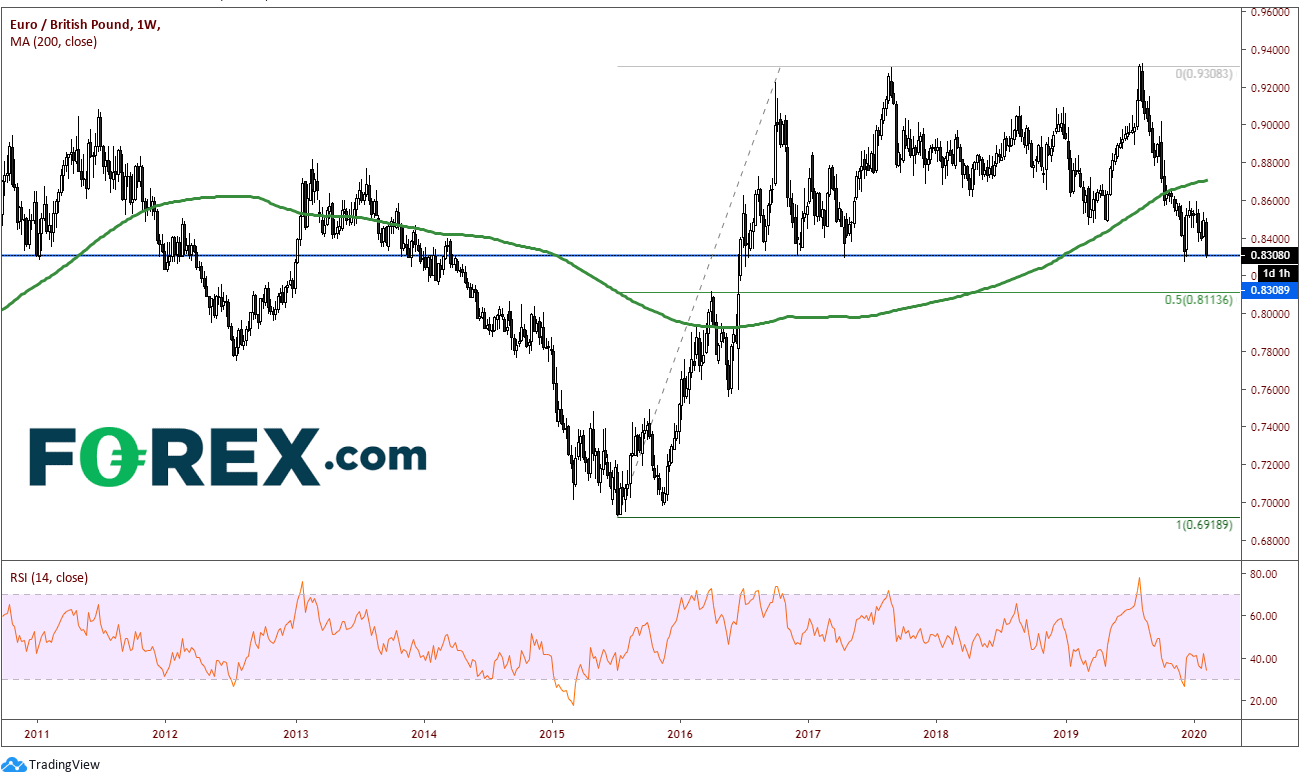
Below that, we have to zoom out to a weekly chart as EUR/GBP would be trading at 2016 levels. There is horizontal support and the 50% retracement level from the July 2015 lows to the summer 2019 highs, near .8115. Although that level is 200 pips lower, if price does reach it, there are likely to be strong buyers with ahead of that level with stops building below it.
Source: Tradingview, City Index
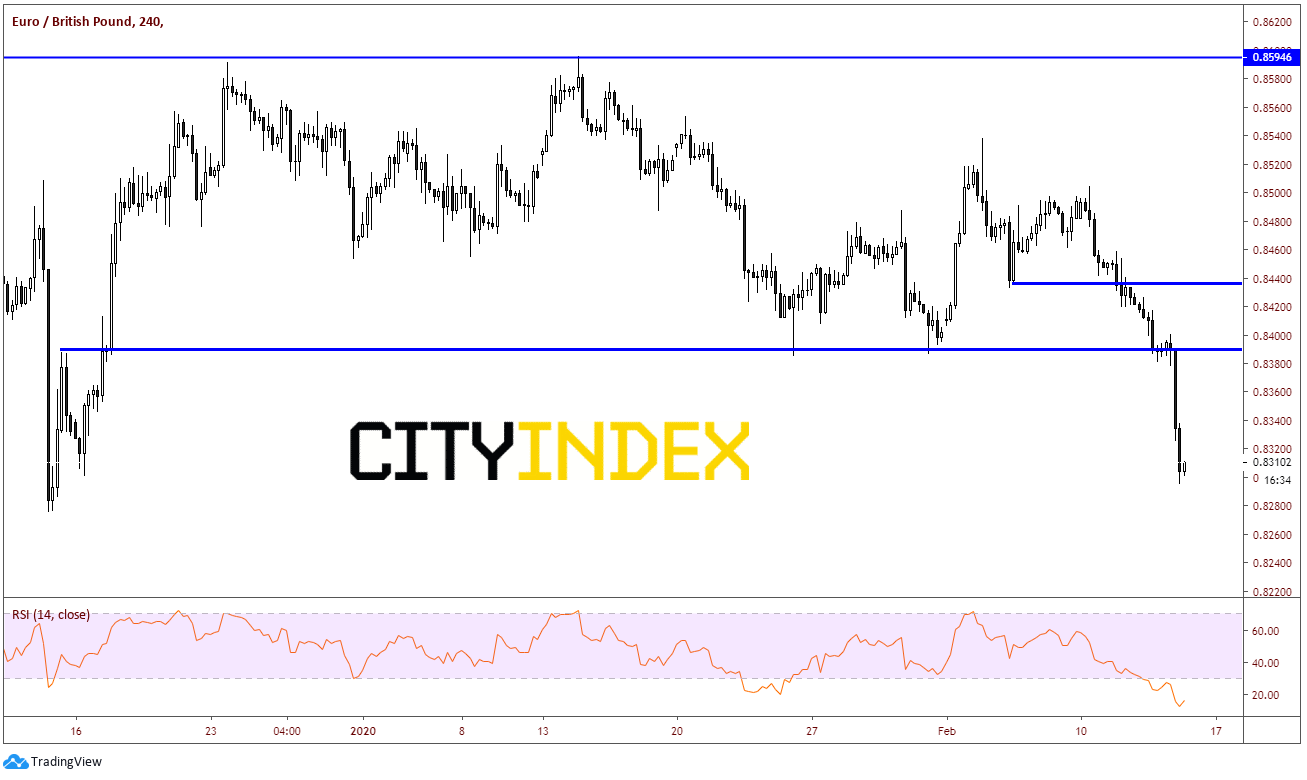
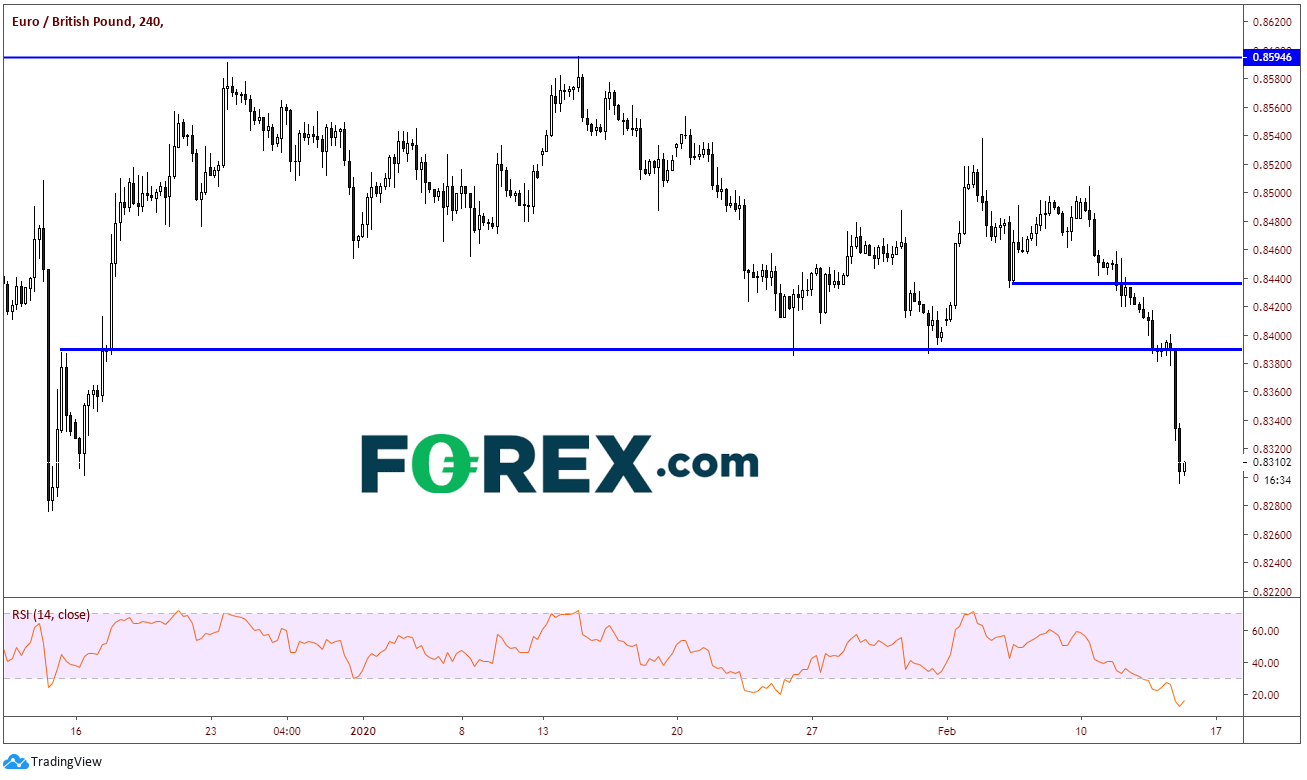
First resistance isn’t until near .8390, however notice on the 240-minute chart how the RSI in below 20, in extremely oversold territory. Price may bounce for the RSI to unwind. Above there, the next level of resistance is near .8435. The ultimate resistance though isn’t until the 2020 highs near .8595.
Source: Tradingview, City Index
Although EUR/GBP appears to be heading lower, the short-term RSI allows for the opportunity to bounce first. However, given that EUR/USD has closed near the lows of the day today (again), we can expect sellers to be looking for any bounce to take advantage and push price lower.
EUR/USD has been down 8 of the last 9 trading days, and the 1 day it closed higher, it was only up 4 pips! Once the pair broke the neckline of the head and shoulders pattern last week, if was off to the races. Price has traded from 1.1094 down to today’s lows near 1.0834, which hasn’t been seen since May 2017.
Source: Tradingview, FOREX.com
Since election day on December 13th, 2019, GBP/USD has been trading in a symmetrical triangle. Price hadn’t done too much until last week when it tried to break lower from near the apex of the triangle, only to have that be a false breakdown and trade back into the apex today. Prime Minister Boris Johnson replaced Finance Minister Sajid David with Rishi Sunak, who traders believe will be more likely to induce more fiscal stimulus into the economy. This caused GBP/USD to go bid.
Source: Tradingview, FOREX.com
With today’s price action in the Euro (lower) and Pound (higher), it seems logical that the next pair one would look at would be EUR/GBP, which is down almost 1% on the day. Technically, the pair has been trading nicely since August 2019, completing a flag pattern (blue) and almost reaching target (close enough for horseshoes) of a pennant pattern (orange). EUR/GBP reached a low of .8275 on UK election day, which was the low of the year for the pair. Price then bounced. However, with the Euro lower and the Pound stronger today, price is nearing the election lows once again. Price is currently trading near .8305. The first support for EUR/GBP is the .8275 level. Below that is the 127.2% Fibonacci extension level from the lows of May 8th, 2019 to the highs on August 12th, 2019 which is .8248. And although the previous mentioned pennant was almost reached, it once again is on our radar near .8165.

Below that, we have to zoom out to a weekly chart as EUR/GBP would be trading at 2016 levels. There is horizontal support and the 50% retracement level from the July 2015 lows to the summer 2019 highs, near .8115. Although that level is 200 pips lower, if price does reach it, there are likely to be strong buyers with ahead of that level with stops building below it.
Source: Tradingview, FOREX.com
First resistance isn’t until near .8390, however notice on the 240-minute chart how the RSI in below 20, in extremely oversold territory. Price may bounce for the RSI to unwind. Above there, the next level of resistance is near .8435. The ultimate resistance though isn’t until the 2020 highs near .8595.
Source: Tradingview, FOREX.com
Although EUR/GBP appears to be heading lower, the short-term RSI allows for the opportunity to bounce first. However, given that EUR/USD has closed near the lows of the day today (again), we can expect sellers to be looking for any bounce to take advantage and push price lower.



The complete CFD trading experience
Award-winning platforms, competitive spreads, low commissions and dedicated support.
We live and breathe the markets and are dedicated to helping traders realise their ambitions as we continue to set the industry bar.
Economic calendar
Web Trader platform
Our sophisticated web-based platform is packed with features.
Related articles

AUD/USD Bulls Fight Back After Australian Jobs Shock
AUD/USD has been hit by another ugly Australian employment report, sending RBA rate hike expectations sharply lower. Yet the relationships driving the currency have shifted since quarter-end, and improving risk appetite could provide the fuel for a recovery.

USD/JPY Update: Can the Japanese Yen Sustain Its Recovery?
Short-term price action around the Japanese yen has started to show some relative improvement over recent sessions. This can be seen in the recent performance of USD/JPY, which has now recorded three consecutive daily declines in favor of the Japanese currency, resulting in a depreciation of roughly 0.35% over the period.


EUR/USD Sell-Off Snaps Back, What’s the True Trend?
EUR/USD was mired in an aggressive continuation of the sell-off after CPI yesterday, but a strong rally from the lows illustrates a stretched marked showing elements of exhaustion.

StoneX Europe Ltd may make third party material available on this website which may contain information included but not limited to the conditions of financial markets. The material is for information purposes only and does not contain, and should not be construed as containing, investment advice and/or investment recommendation and/or an investment research and/or an offer of or solicitation for any transactions in financial instruments; any decision to enter into a specific transaction shall be made by the client following an assessment by him/her of their situation.
StoneX Europe Ltd makes no representation or warranty and assumes no liability as to the accuracy or completeness of the information provided, nor any loss arising from any investment based on a recommendation, forecast or other information supplied. You should always seek independent advice as to your suitability to speculate in any related markets and your ability to assume the associated risks, if you are at all unsure. We are not under any obligation to update any such material. Any opinion made may be personal to the author and may not reflect the opinion of StoneX Europe Ltd.