





EURJPY Headline Trading at its Best
If one is looking to trade headlines, it’s best to be aware of the longer-term direction of the trend!
Share this:

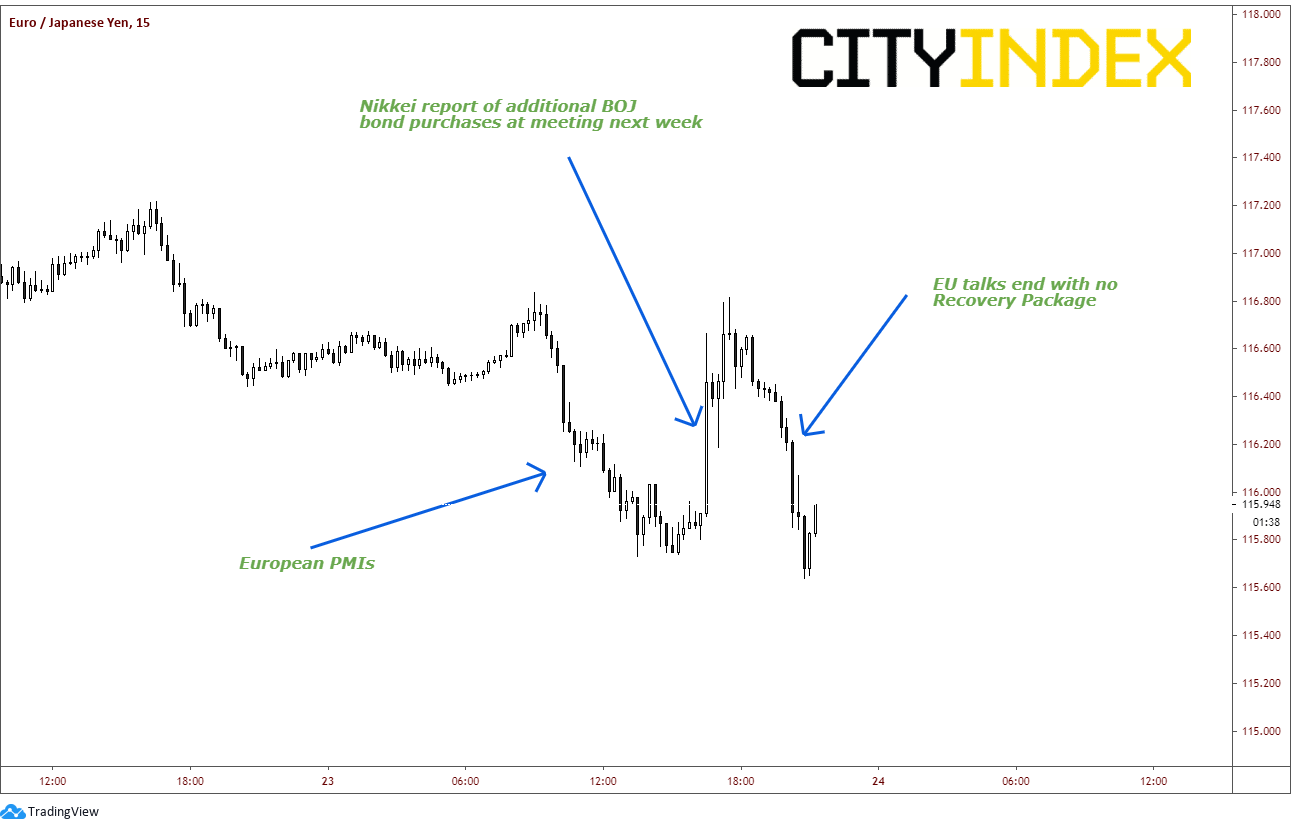
It has been quite volatile for the Euro vs the Japanese Yen today. Let’s review some of the headlines that have been released over the past 24 hours that have affected the direction of EUR/JPY:
1) European PMIs were released over the first few hours of the European session. For the most part, the data was worse than expected, which caused EUR/JPY to slowly move lower from roughly 116.60 to 115.73.
2) Just before the US market opened, the Nikkei reported that the Bank of Japan (BoJ) was considering “unlimited” bond buying at its meeting next week and my double the purchases of corporate bonds and commercial paper. EUR/JPY quickly moves higher from roughly 115.80 to 116.65.
3) EU leaders end talks with no agreement on recovery package. France’s Macron said, “Europe has no future if we cannot find a response to this exceptional shock”. EUR/JPY moved back below 115.80 on these comments. (Although talks end without a package, Germany’s Merkel and Italy’s Conte say progress has been made.)
Source: Tradingview, City Index
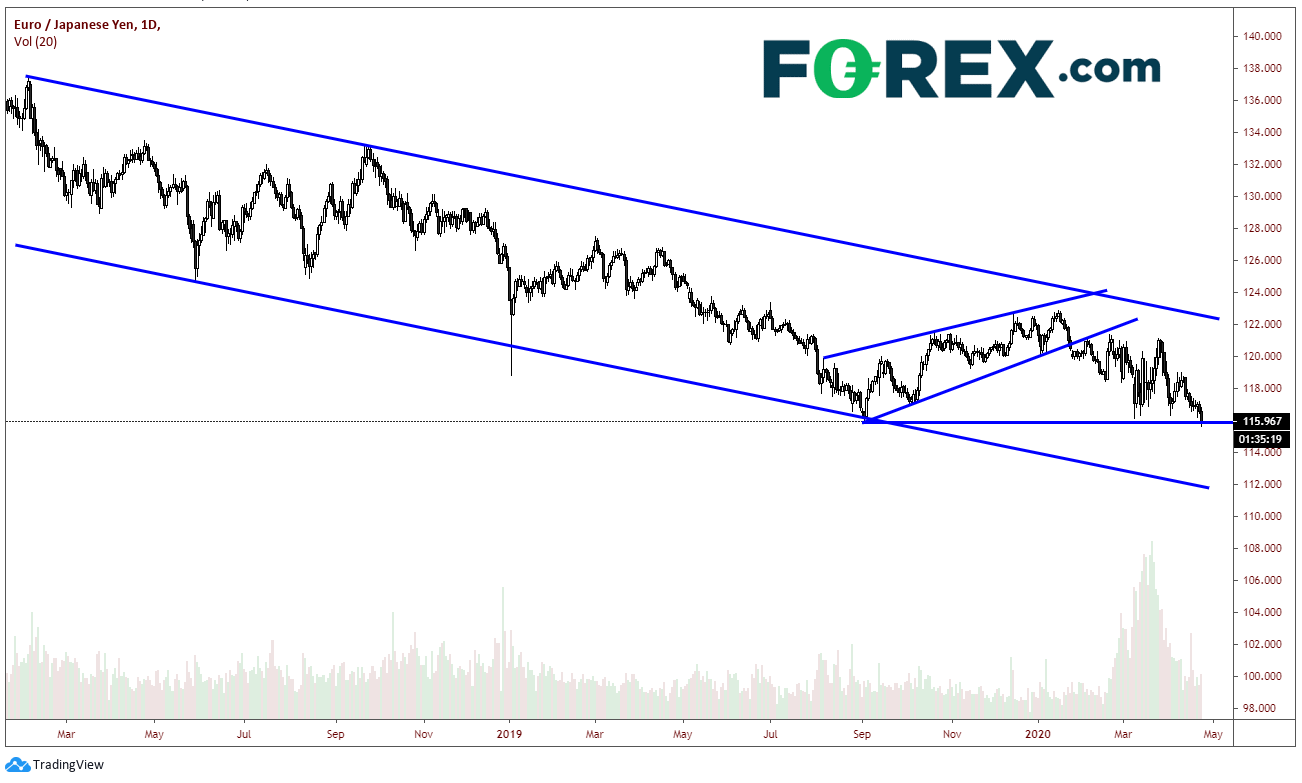
On a daily timeframe chart, it appears that over the long-term, EUR/JPY was heading down to 116.00 regardless of the comments . Today’s bounce was used as an opportunity for bears to add to positions and push the pair lower. EUR/JPY has been in a downward sloping channel since January 2018. More recently, EUR/JPY had been in an ascending wedge from August 2019 to January of this year. The pair broke lower on January 29th and traded violently to the 100% retracement target of the ascending wedge TODAY at 115.86.
Source: Tradingview, City Index
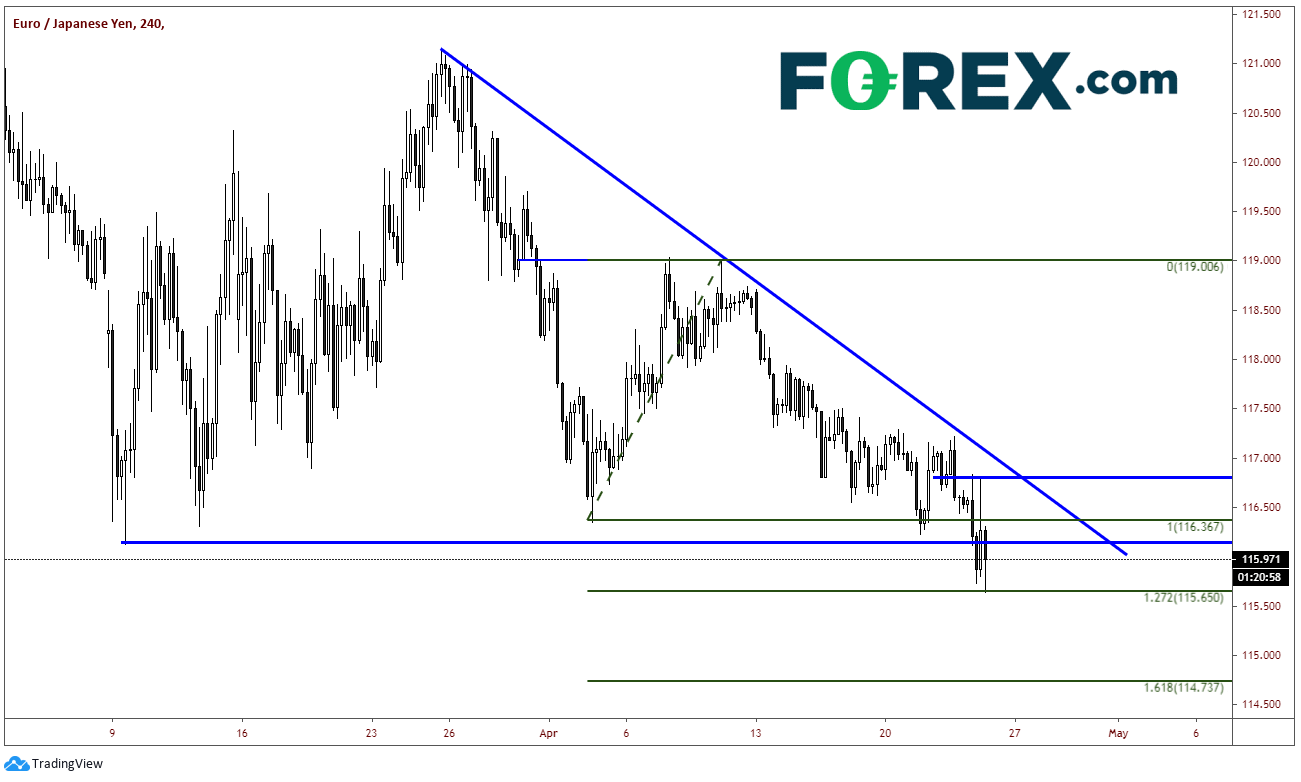
On a 240-minute timeframe, EUR/JPY has been trading in a descending triangle since March 25th . Today price finally broke below the horizontal support level at 116.10. That level now acts as the first level of resistance. The next level of resistance is today’s highs 116.83 and then the downward sloping trendline from the triangle near 117. First support is down at today’s lows near 115.65, which is also the 127.2% Fibonacci extension level from the lows on April 2nd to the highs on April 9th. Below that, support is at the 161.8% Fibonacci extension from the same time period at 114.73 and final support is at the bottom, downward sloping trendline of the long-term channel (on the daily) near 112.00.
Source: Tradingview, City Index
If one is looking to trade the short-term headlines, it’s best to look at the longer-term trend to determine which direction to trade. Traders who had been aware of the longer-term, descending channel or the descending triangle in EUR/JPY would have also been aware to “sell the rips” on the headlines today!
It has been quite volatile for the Euro vs the Japanese Yen today. Let’s review some of the headlines that have been released over the past 24 hours that have affected the direction of EUR/JPY:
1) European PMIs were released over the first few hours of the European session. For the most part, the data was worse than expected, which caused EUR/JPY to slowly move lower from roughly 116.60 to 115.73.
2) Just before the US market opened, the Nikkei reported that the Bank of Japan (BoJ) was considering “unlimited” bond buying at its meeting next week and my double the purchases of corporate bonds and commercial paper. EUR/JPY quickly moves higher from roughly 115.80 to 116.65.
3) EU leaders end talks with no agreement on recovery package. France’s Macron said, “Europe has no future if we cannot find a response to this exceptional shock”. EUR/JPY moved back below 115.80 on these comments. (Although talks end without a package, Germany’s Merkel and Italy’s Conte say progress has been made.)
Source: Tradingview, FOREX.com
On a daily timeframe chart, it appears that over the long-term, EUR/JPY was heading down to 116.00 regardless of the comments . Today’s bounce was used as an opportunity for bears to add to positions and push the pair lower. EUR/JPY has been in a downward sloping channel since January 2018. More recently, EUR/JPY had been in an ascending wedge from August 2019 to January of this year. The pair broke lower on January 29th and traded violently to the 100% retracement target of the ascending wedge TODAY at 115.86.
Source: Tradingview, FOREX.com
On a 240-minute timeframe, EUR/JPY has been trading in a descending triangle since March 25th . Today price finally broke below the horizontal support level at 116.10. That level now acts as the first level of resistance. The next level of resistance is today’s highs 116.83 and then the downward sloping trendline from the triangle near 117. First support is down at today’s lows near 115.65, which is also the 127.2% Fibonacci extension level from the lows on April 2nd to the highs on April 9th. Below that, support is at the 161.8% Fibonacci extension from the same time period at 114.73 and final support is at the bottom, downward sloping trendline of the long-term channel (on the daily) near 112.00.
Source: Tradingview, FOREX.com
If one is looking to trade the short-term headlines, it’s best to look at the longer-term trend to determine which direction to trade. Traders who had been aware of the longer-term, descending channel or the descending triangle in EUR/JPY would have also been aware to “sell the rips” on the headlines today!
Related tags:
Latest market news




The complete CFD trading experience
Award-winning platforms, competitive spreads, low commissions and dedicated support.
We live and breathe the markets and are dedicated to helping traders realise their ambitions as we continue to set the industry bar.
Economic calendar
Web Trader platform
Our sophisticated web-based platform is packed with features.
Related articles
EUR/USD Forecast: Euro Struggles to Find Support Even After U.S. PCE Data
The euro continues to face a challenging environment in the short term. The currency has struggled to regain ground against a U.S. dollar that remains firmly supported, a dynamic reflected in EUR/USD, which has now recorded three consecutive losing sessions and a decline of roughly 0.6%.
Canadian Dollar Forecast: USD/CAD Four-Week Rally Eyes Yearly Highs 9 30 2026
USD/CAD has advanced in 14 of the past 15 sessions, but stretched momentum raises the stakes as major resistance and NFP come into focus.

British Pound Technical Outlook: GBP/USD Rebound Challenges September Downtrend 9 30 2026
Sterling has rallied sharply from key support, with GBP/USD at an inflection point that could determine whether a larger recovery is underway.
StoneX Europe Ltd may make third party material available on this website which may contain information included but not limited to the conditions of financial markets. The material is for information purposes only and does not contain, and should not be construed as containing, investment advice and/or investment recommendation and/or an investment research and/or an offer of or solicitation for any transactions in financial instruments; any decision to enter into a specific transaction shall be made by the client following an assessment by him/her of their situation.
StoneX Europe Ltd makes no representation or warranty and assumes no liability as to the accuracy or completeness of the information provided, nor any loss arising from any investment based on a recommendation, forecast or other information supplied. You should always seek independent advice as to your suitability to speculate in any related markets and your ability to assume the associated risks, if you are at all unsure. We are not under any obligation to update any such material. Any opinion made may be personal to the author and may not reflect the opinion of StoneX Europe Ltd.