




EUR/USD, USD/CAD Analysis: European open – 10th July 2023
Much of the price action among FX majors during the Asian session was dedicated to retracing against Friday’s moves (which saw the US dollar strengthen, but not by much). The majority of daily ranges for FX majors are below 55% and 1-day implied volatility is also below historical volatility levels which warns of a quieter start to the week. Today's charts looks at potential opportunities on EUR/USD and USD/CAD.
Share this:

Asian Indices:
- Australia's ASX 200 index fell by -19 points (-0.27%) and currently trades at 7,023.30
- Japan's Nikkei 225 index has fallen by -25.26 points (-0.08%) and currently trades at 32,353.39
- Hong Kong's Hang Seng index has risen by 83.7 points (0.46%) and currently trades at 18,449.40
- China's A50 Index has risen by 61.41 points (0.49%) and currently trades at 12,503.18
UK and Europe:
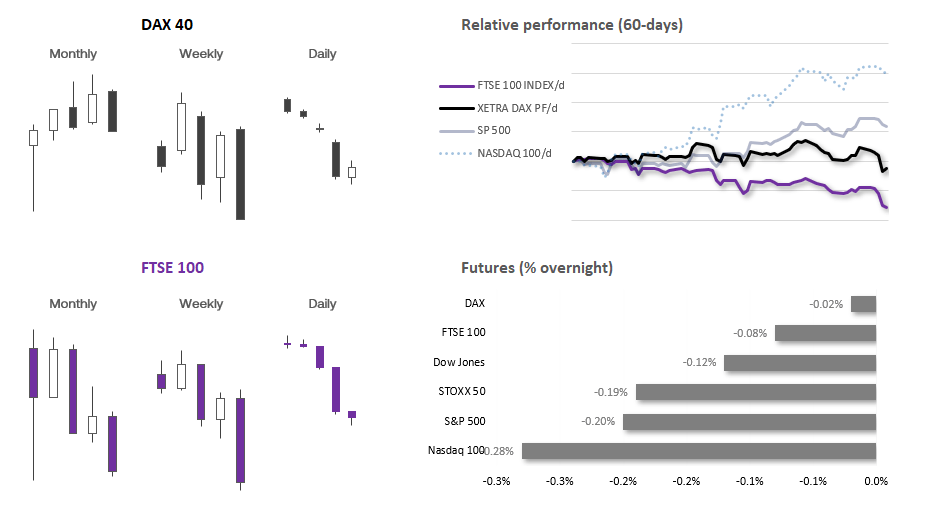
- UK's FTSE 100 futures are currently down -6 points (-0.08%), the cash market is currently estimated to open at 7,250.94
- Euro STOXX 50 futures are currently down -10 points (-0.23%), the cash market is currently estimated to open at 4,226.60
- Germany's DAX futures are currently down -6 points (-0.04%), the cash market is currently estimated to open at 15,597.40
US Futures:
- DJI futures are currently down -40 points (-0.12%)
- S&P 500 futures are currently down -8.25 points (-0.19%)
- Nasdaq 100 futures are currently down -41.25 points (-0.27%)
- Equity markets were mixed during the Asian session, with China’s markets leading the way on hopes of more economic stimulus following another deflationary report form the world’s second largest economy
- Weak demand saw factory prices in China fall at their fastest pace in over seven years at -5.4% y/y and CPI come in flat at 0% y/y, helping USD/CNH to rise around 0.2%
- The Nikkei fell to a 4-week low before recouping earlier losses and is on track to form a Doji (indecision candle) which hints at a cycle low
- The DAX fell over -4.5% between last week’s high to low, but early signs of stability were found on Friday with a small bullish candle
- However, the DAX closed beneath the 50-day EMA and May low but remains above the December 2023 trendline, so we expect cautious trade around the cycle lows, even though last week’s selloff lost some of its ferocity on Friday
Much of the price action among FX majors during the Asian session was dedicated to retracing against Friday’s moves. And the theme on Friday was a weaker US dollar following a soft headline nonfarm payrolls print, even though most other economic data points justify a more hawkish Fed. Sure, NFP came in ~200k and below expectations and the previous print, but unemployment is a very healthy 3.6% and ADP employment added close to half a million jobs whilst job layoffs were also lower.
The majority of daily ranges for FX majors are below 55% and 1-day implied volatility is also below historical volatility levels which warns of a quieter start to the week.
Whilst we have three Fed members speaking overnight, one has to question how relevant it is given FOMC minutes were more hawkish than expected and data since the Fed’s last meeting justifies higher interest rates.
- EUR/GBP fell back towards (but held just above) the June low last week, but two Doji’s near the cycle lows on Thursday and Friday warns of the potential for a corrective bounce higher against its bearish daily trend
- GBP/USD is pulling back from Friday’s highs, but the strong bullish structure of the daily chart favours a breakout above the June high and move towards the 1.30 handle
- USD/JPY has managed to lift itself higher from Friday’s lows above the 142 handle, yet not even recoup half of Friday’s 200-pip decline. As mentioned in this week’s COT report, we suspect a correction is now underway having reached 145 with net-long exposure sitting at a likely sentiment extreme
- Gold is trading within a choppy range between 1900 – 1940, which makes it preferable for smaller hold times (intraday trading), until we see a clear breakout of its range
EUR/USD 1-hour chart:
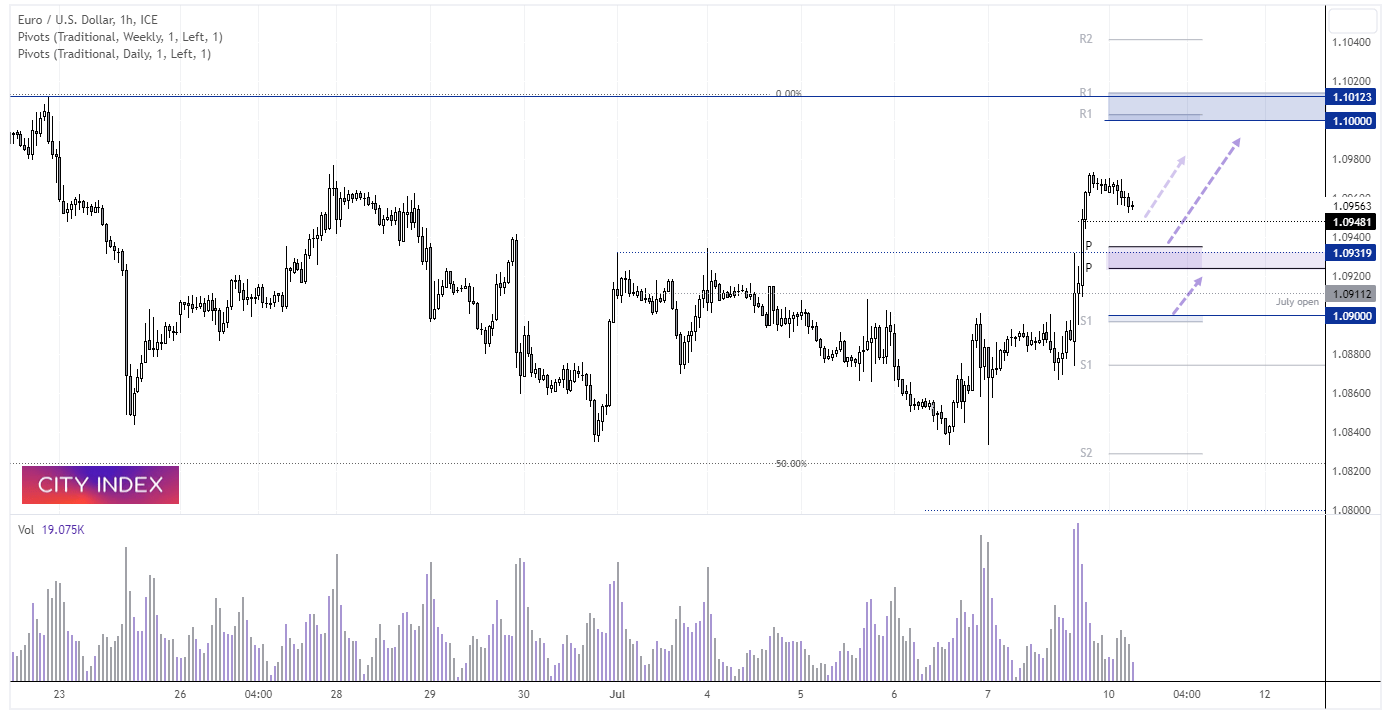
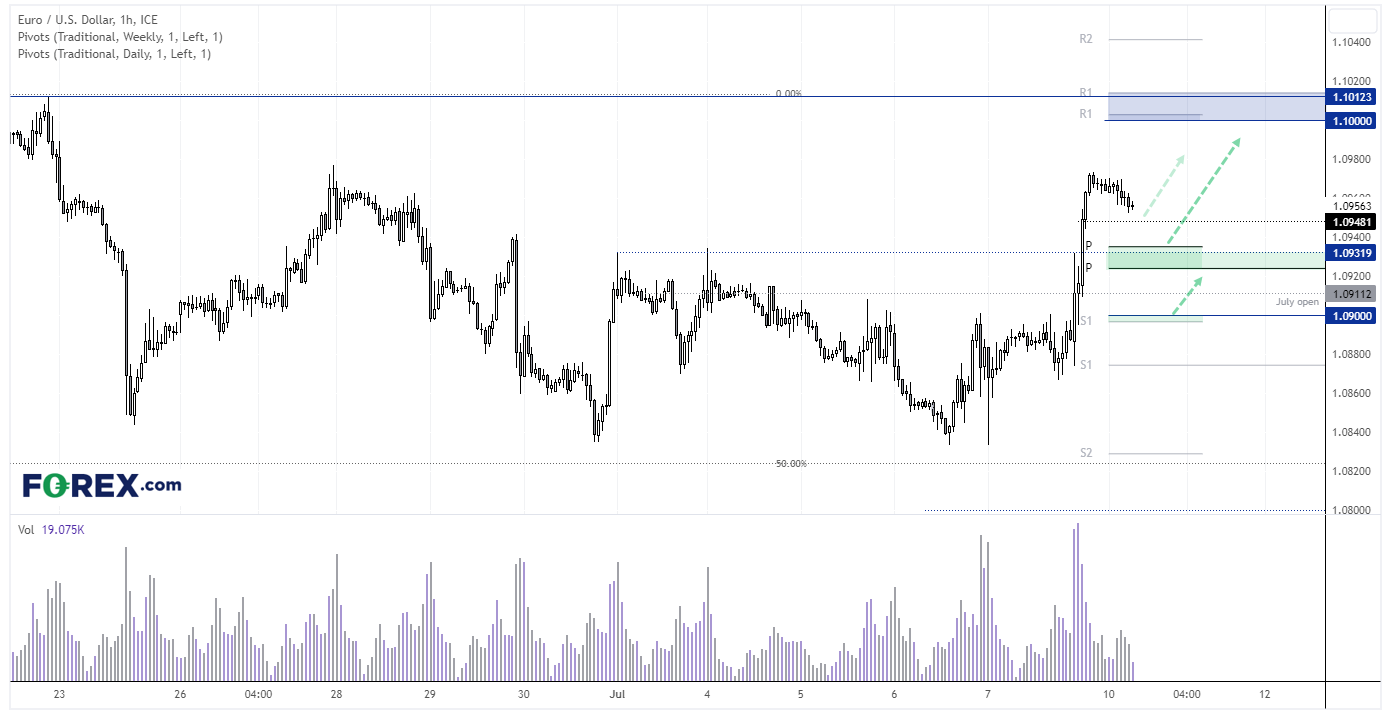
EUR/USD has mostly been confined within the 1.0850 – 1.1000 range over the past three weeks, but the past two weeks have produced bullish closed with lower wicks, to form a double bottom around 1.0836. Another crack at 1.1000 seems achievable given it trades less than 40 pips from the big round number, but we’d prefer to see a retracement before reconsidering longs to help increase the potential reward to risk ratio.
The daily chart shows a bullish engulfing candle formed on Thursday around the 50-day EMA ahead of Friday’s rally, and prices have remain within a tight range near the highs overnight. An initial move lower seems likely (and desirable) from current levels, at which point we would seek evidence of a swing low in an intraday timeframe around a support level.
Potential support levels include a volume cluster around 1.098, the daily / weekly pivot points around 1.0923 – 1.0935, or the 1.0900 handle near the daily S1 pivot.
USD/CAD daily chart:
A bearish hammer week formed on USD/CAD just beneath the 1.34 handle, and a prominent bearish engulfing candle formed on Friday thanks to a strong Canadian employment report. This has seen odds sway in favour of a 25bp hike from the BOC this week, but leaves the debate open as to whether it will a ‘one and done’ or a hawkish hike is delivered.
Technically, it appears as though USD/CAD has formed a three-wave correction against the preceding move, which may have completed around the 50% retracement level and 50-day EMA. Prices have drifted higher during Asian trade, but bears could consider fading into any low volatility retracements within Friday’s range to see if momentum turns lower as part of a swing trade short. The initial target could be the June low, a break beneath which brings the 1.30 handle in to focus. And a softer-than-expected US inflation report this week, coupled with a hawkish 25bp hike from the BOC could certainly help the bear camp.


View the full economic calendar
View the full economic calendar
-- Written by Matt Simpson
Follow Matt on Twitter @cLeverEdge
How to trade with City Index
You can trade with City Index by following these four easy steps:
- Open an account, or log in if you’re already a customer
• Open an account in the UK
• Open an account in Australia
• Open an account in Singapore
- Search for the market you want to trade in our award-winning platform
- Choose your position and size, and your stop and limit levels
- Place the trade
Related tags:
Latest market news




The complete CFD trading experience
Award-winning platforms, competitive spreads, low commissions and dedicated support.
We live and breathe the markets and are dedicated to helping traders realise their ambitions as we continue to set the industry bar.
Economic calendar
Web Trader platform
Our sophisticated web-based platform is packed with features.
Related articles
EUR/USD weekly outlook: Oil, inflation and NFP in focus
After coming under significant pressure in recent weeks, the EUR/USD came off its lows to finish the week on a positive note on Friday, albeit with only a mild rebound. That was not enough to prevent the exchange rate falling for the third consecutive week, as the US dollar and bond yields rallied across the board.

Gold Q4 2026 outlook: Resilience in the face of rallying dollar and yields
As we headed towards the latter stages of Q3 and into Q4, the Fed had just hiked rates in a hawkish FOMC meeting, while the likes of the ECB and BoJ had also tightened their respective policies. Oil prices remained elevated amid the prolonged US-Iran conflict. Meanwhile, bond yields were breaking out, and the dollar was higher across the board. Yet, remarkably, gold was still holding in the positive territory for the third quarter, even if it had weakened somewhat in September.

EUR/USD Q4 2026 Outlook: Euro at a Crossroads as Fed, ECB Tighten 9 25 2026
EUR/USD enters Q4 at a pivotal inflection point as competing Fed-ECB policy paths and persistent inflation risks collide with major technical support.

StoneX Europe Ltd may make third party material available on this website which may contain information included but not limited to the conditions of financial markets. The material is for information purposes only and does not contain, and should not be construed as containing, investment advice and/or investment recommendation and/or an investment research and/or an offer of or solicitation for any transactions in financial instruments; any decision to enter into a specific transaction shall be made by the client following an assessment by him/her of their situation.
StoneX Europe Ltd makes no representation or warranty and assumes no liability as to the accuracy or completeness of the information provided, nor any loss arising from any investment based on a recommendation, forecast or other information supplied. You should always seek independent advice as to your suitability to speculate in any related markets and your ability to assume the associated risks, if you are at all unsure. We are not under any obligation to update any such material. Any opinion made may be personal to the author and may not reflect the opinion of StoneX Europe Ltd.